Document observability hub
The Collaboration documents section lets you monitor the lifecycle of collaboration documents in an environment. It is a great place to start when investigating what happened to a document and when. For any document, you can check its current collaboration session and storage status, browse a chronological history of related events, review its save history, and download debug snapshot bundles for recovery or troubleshooting.
The feature is available in the Cloud Services Portal (or the Management Panel when using On-Premises). Open the Collaboration documents section for the selected environment.
The Insights panel gathers environment-wide business logs, while the Document observability hub focuses on the per-document collaboration lifecycle (sessions, saves, and snapshots). The two views complement each other. See the Insights panel guide.
The landing view lists every document in the environment together with its current state, so you can check its status and spot problems at a glance.
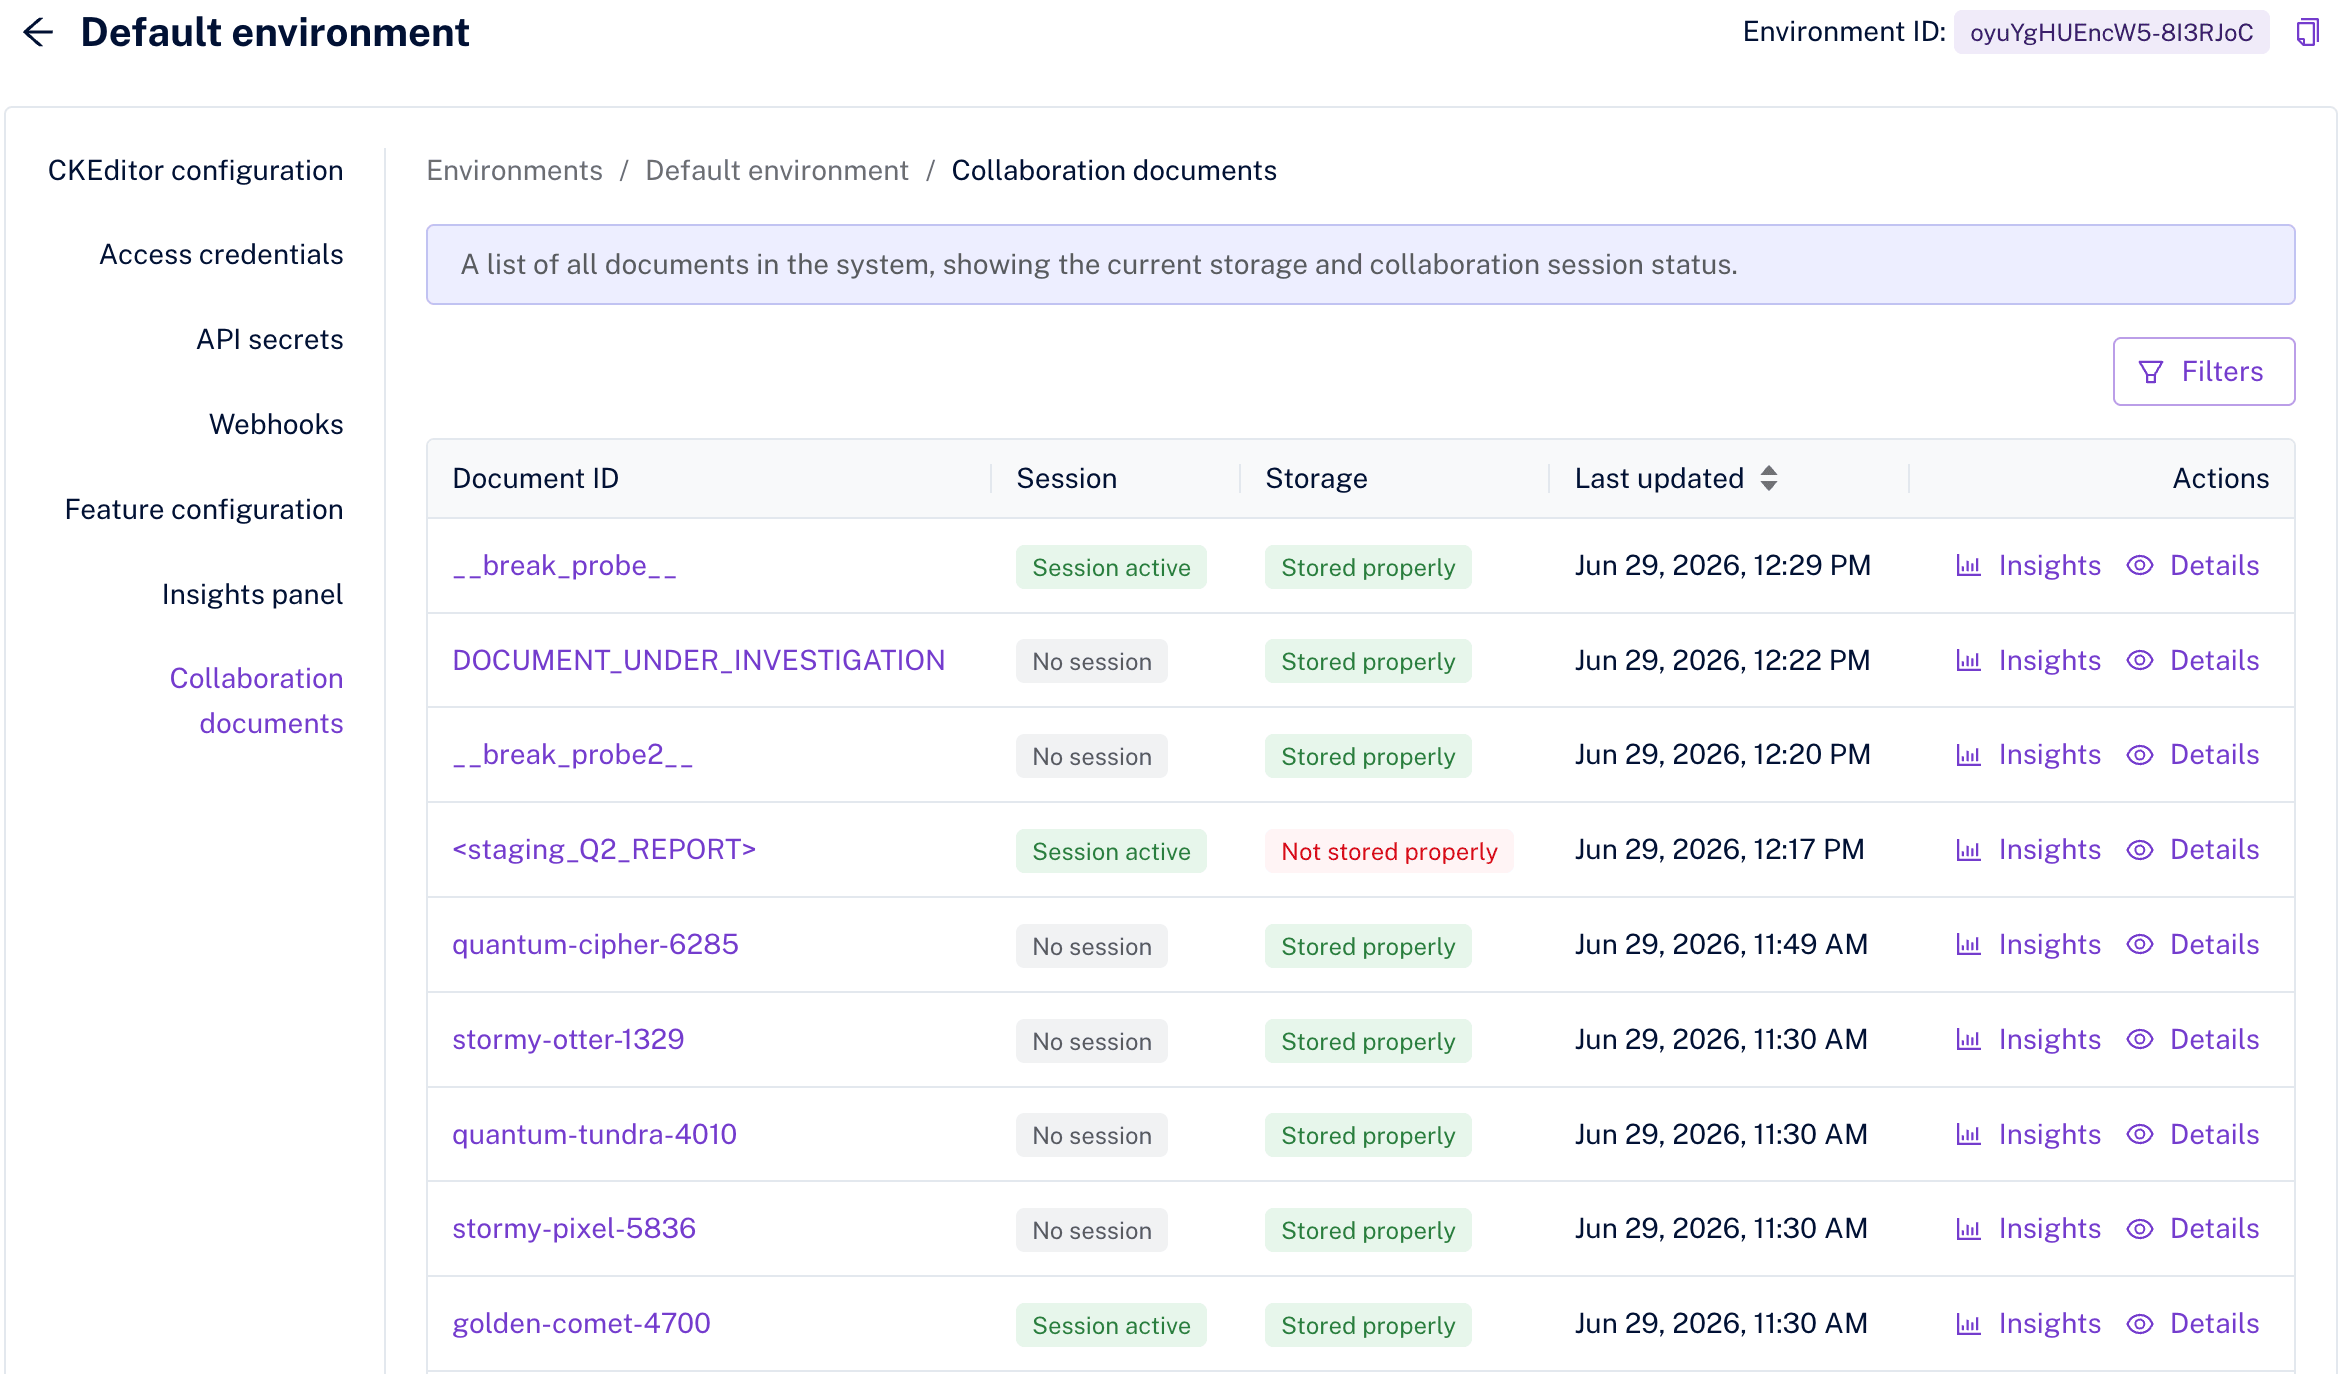
The Session and Storage columns show the current state of each document. A Not stored properly status (highlighted in red) flags a document whose most recent save failed, Deleted marks a document that was removed from storage, while Unknown means no save information is available yet.
Each row has two actions: Insights opens the Insights panel filtered to that document, and Details opens the per-document view with the Collaboration history, Snapshots, and Storage tabs described below.
Use the Document ID filter to search for any part of a document ID – searching for invoice matches 2026-invoice-084. The search is case-insensitive.
The Collaboration history tab is a chronological log of what happened to a document – its collaboration sessions, storage saves, revisions, exports, and the failures that occurred along the way. It is the quickest way to check what happened to a document and when; for lower-level, more verbose detail on any entry, use the Insights panel.
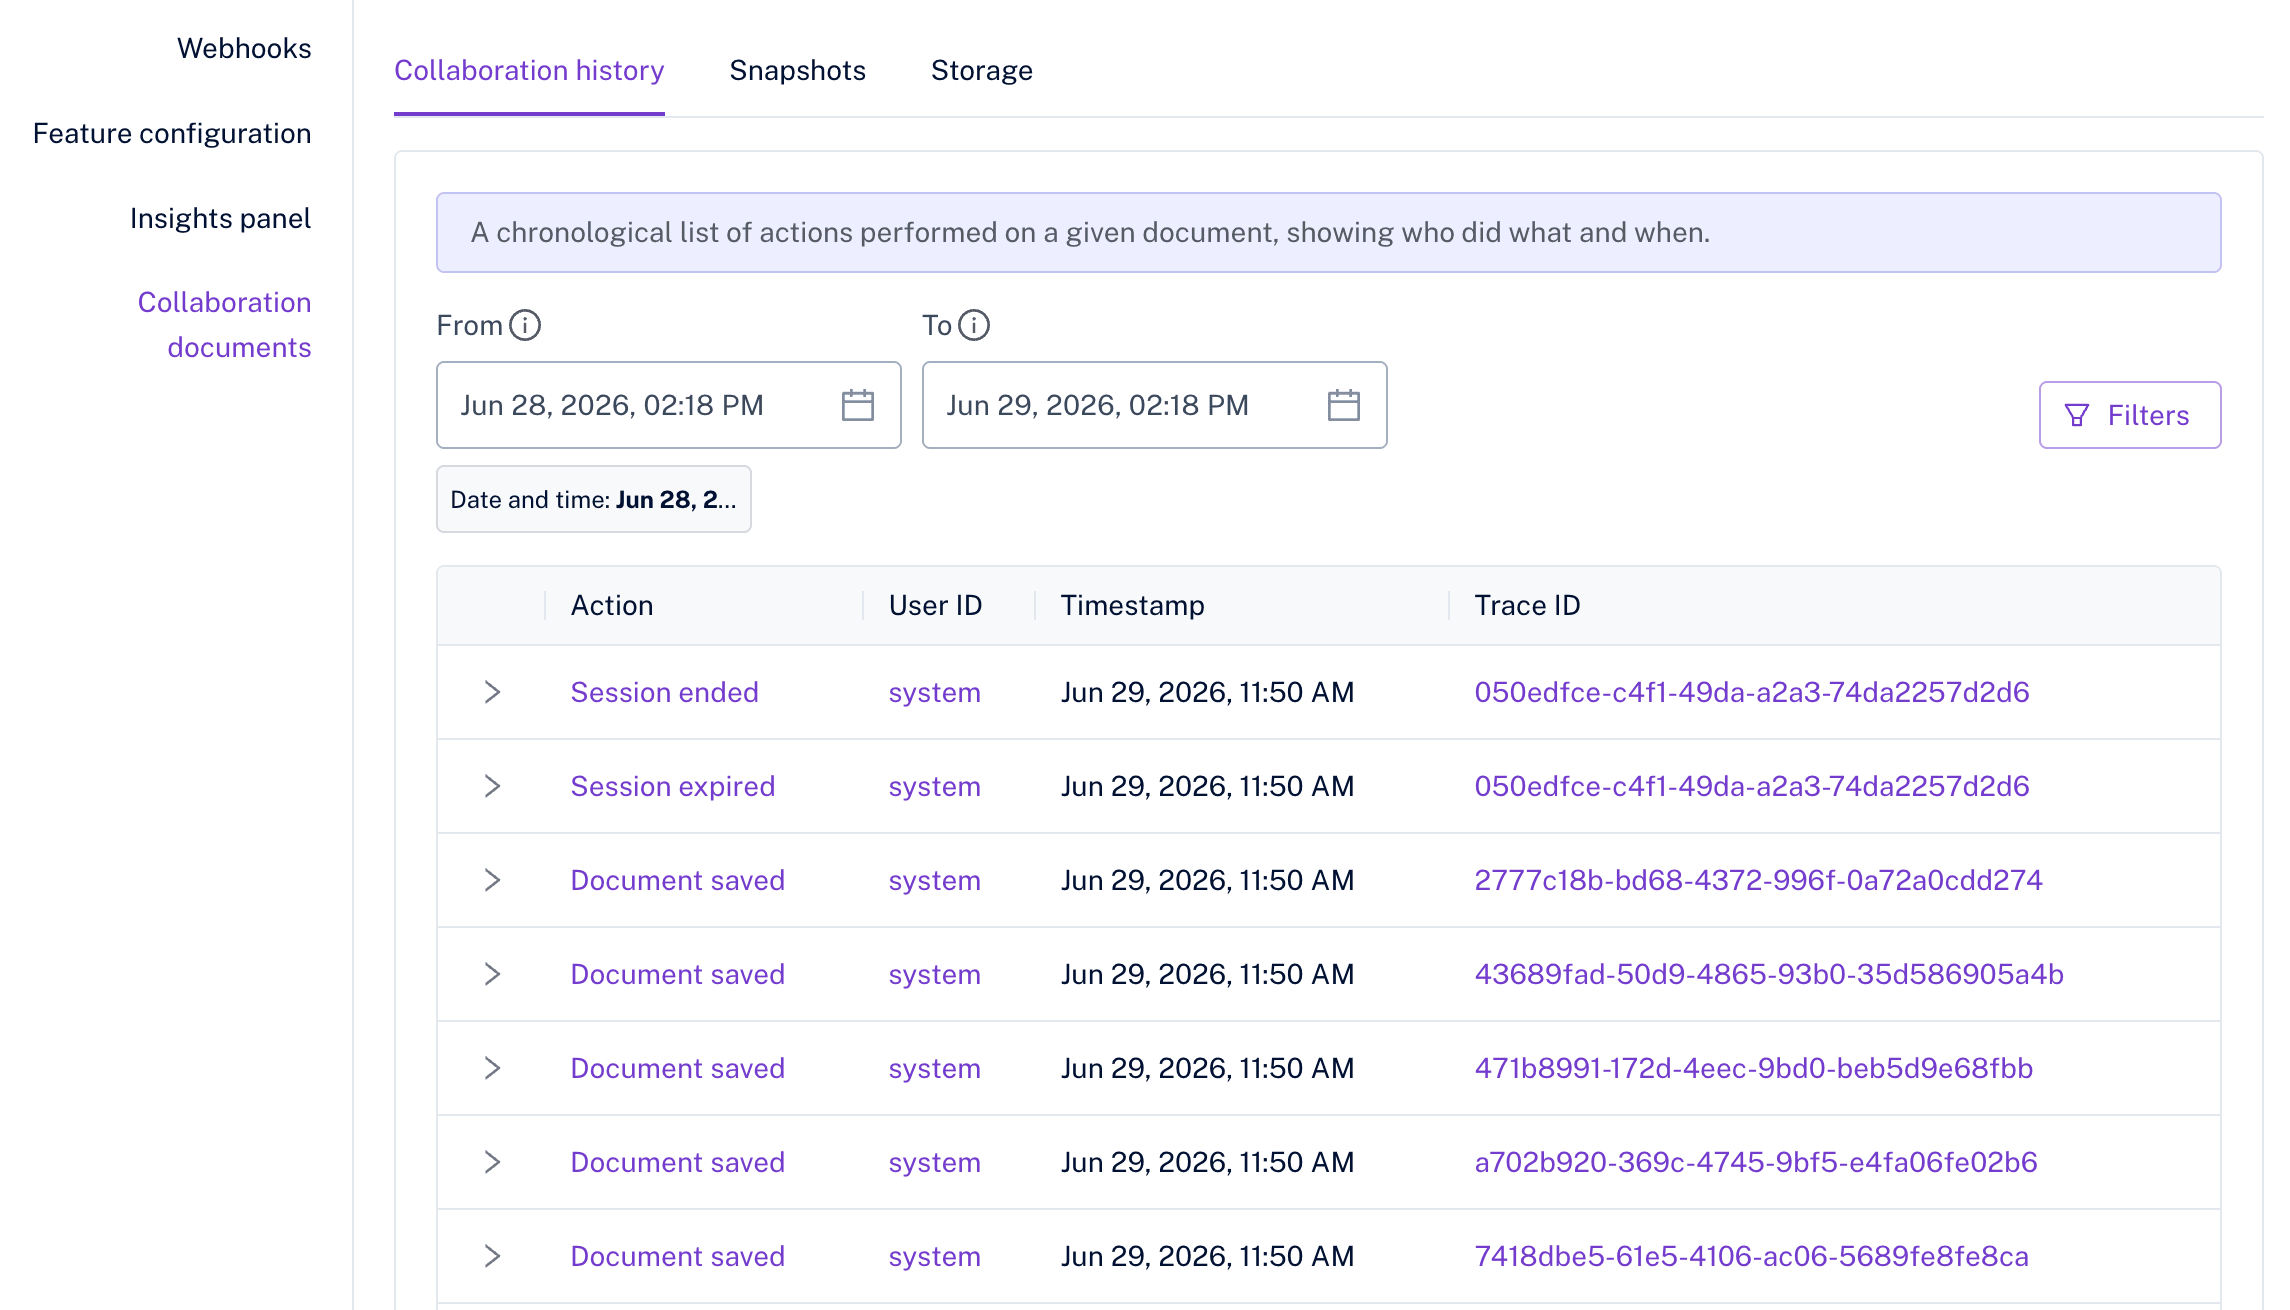
The recorded actions span the document’s lifecycle:
- Collaboration sessions – for example, a session that started, ended, or expired.
- Document storage – for example, content loaded from storage, a save that succeeded or failed, or a document removed from storage.
- Revisions and document history – for example, a saved revision or history compression on a long-running document.
- Session export – for example, an export that completed or failed.
- Editor bundle – for example, a failure while Cloud Services evaluated your uploaded editor bundle, such as when converting content for a save or an export.
The Action filter lists all the action names the hub can record, so you can use it to see exactly what is tracked.
Actions that can be traced to a person carry that user’s ID – for example, the user who opened a collaboration session or updated the document. Actions performed automatically by the server are attributed to the system user, and those triggered through the REST API to rest-api. Each action also carries a Trace ID – click it to open the Insights panel filtered to that trace ID, where you can inspect the detailed logs for that action.
You can filter the history by User ID and Action, and narrow it to a time range with the From / To date pickers. Expand a row to see additional details.
The Snapshots tab lists collaboration snapshot debug bundles. A debug bundle is self-contained – it includes the document snapshot, the editor bundle (if uploaded), and the editor configuration – so it captures everything needed to reproduce or recover the document at that point in time. Download a bundle to recover content or to share with support when investigating an issue.
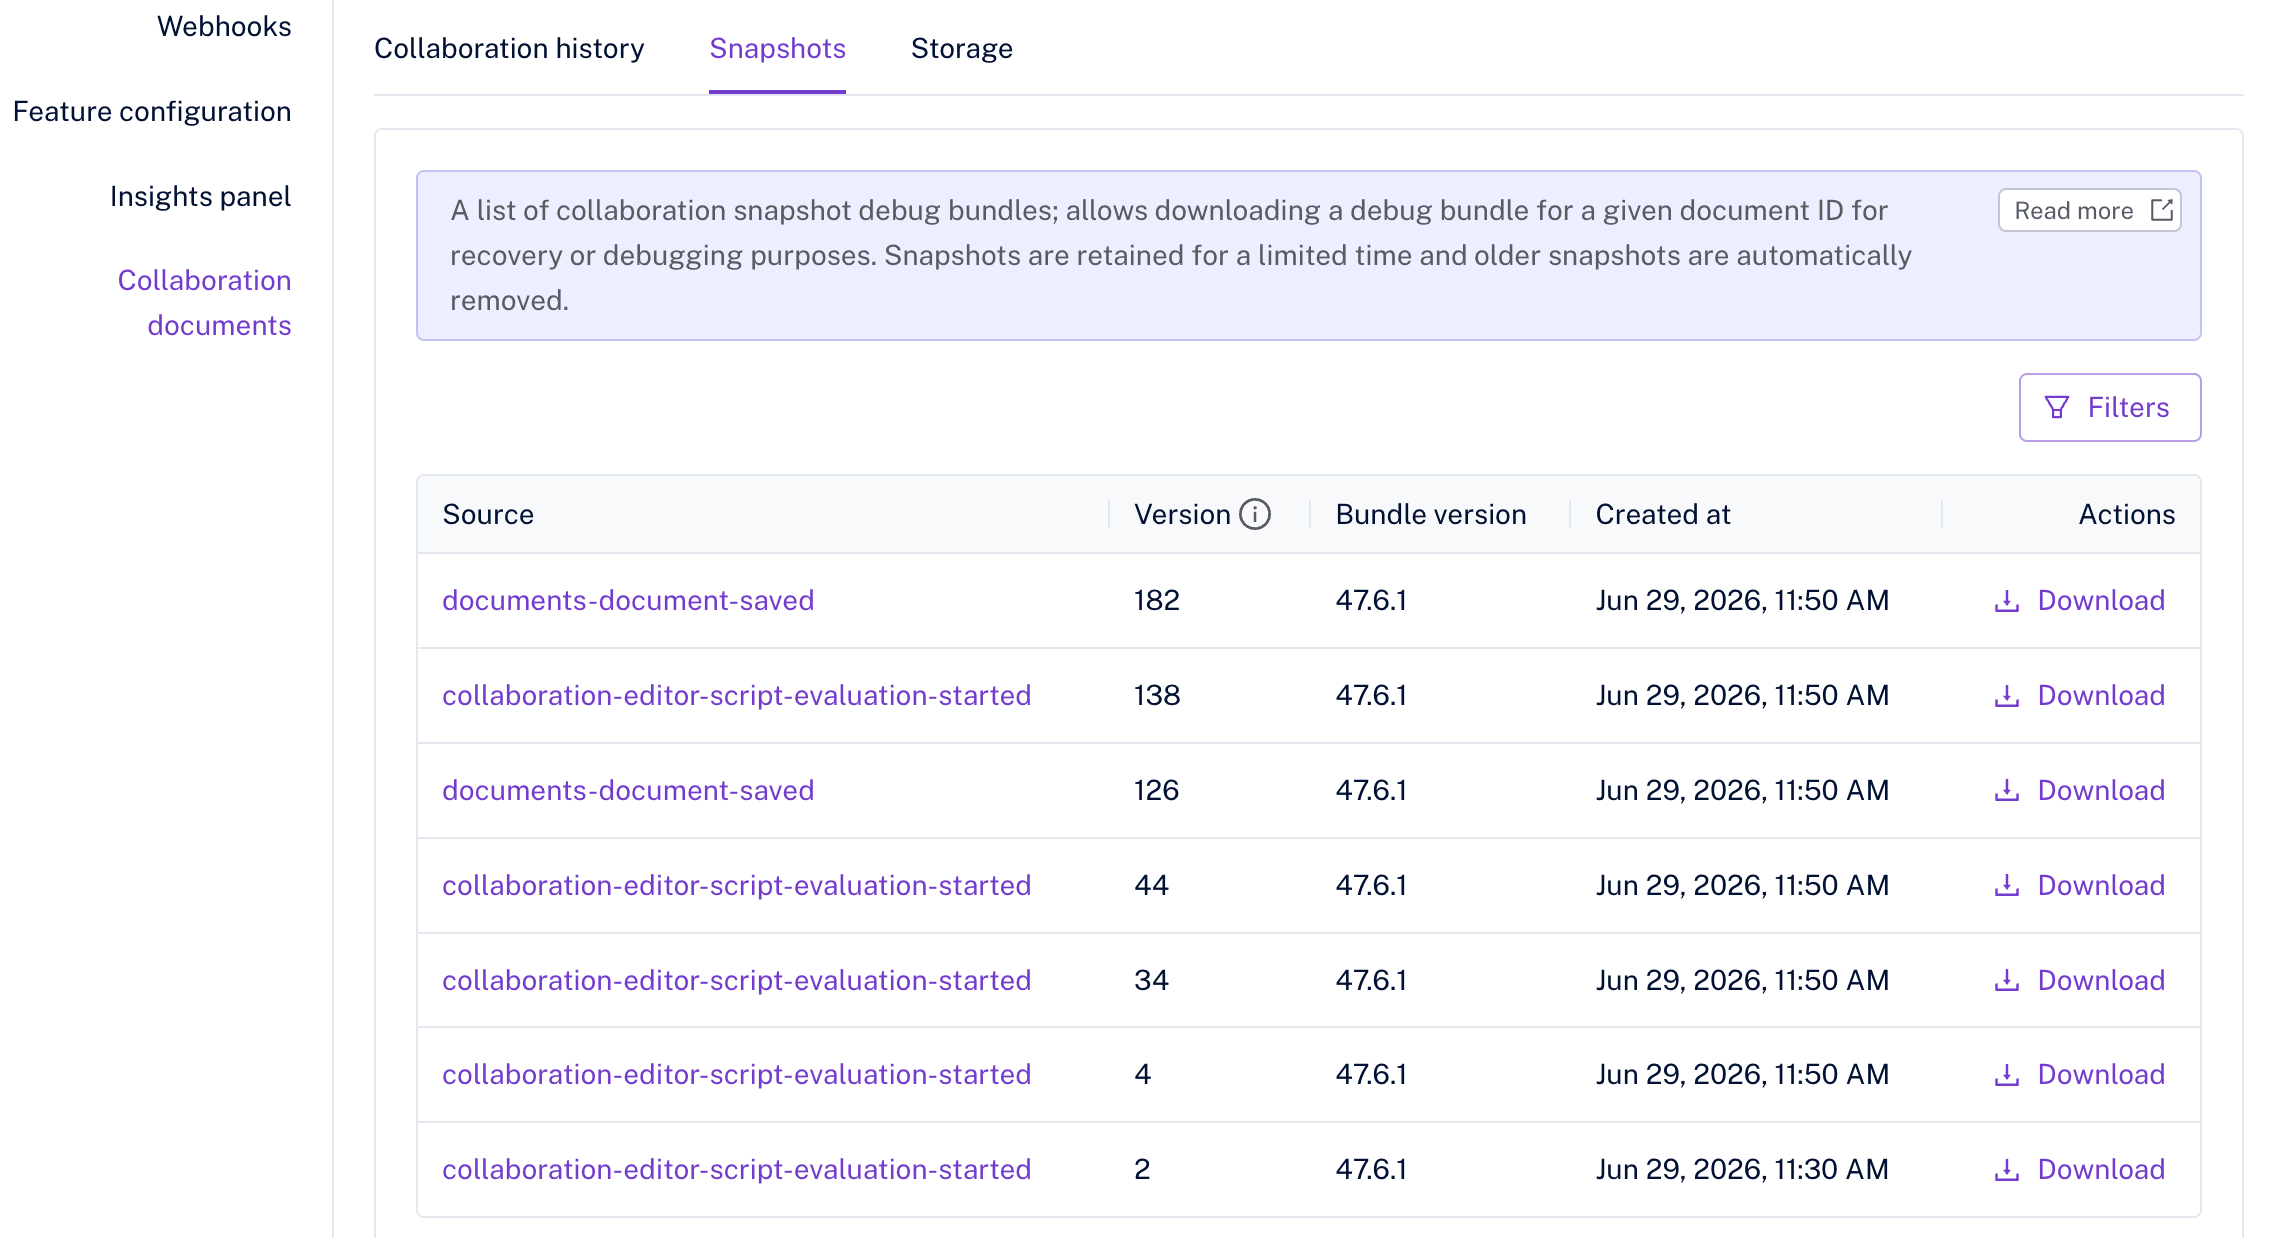
The Source column shows what triggered the snapshot (for example, collaboration-document-session-ended). Use the Download action to retrieve a bundle. You can filter the list by Source and narrow it to a time range with the From / To date pickers.
Snapshots are retained for a limited time; older snapshots are removed automatically.
The Storage tab lists consecutive saves of a document in document storage. It is useful for inspecting current and historic storage size and the status of each save.
The Storage tab is only meaningful when document storage is enabled for the environment. Without it, documents are not saved permanently, so there are no saves to list. When the feature is disabled, the tab shows a warning saying so and points you to the Feature configuration section, where you can enable it.
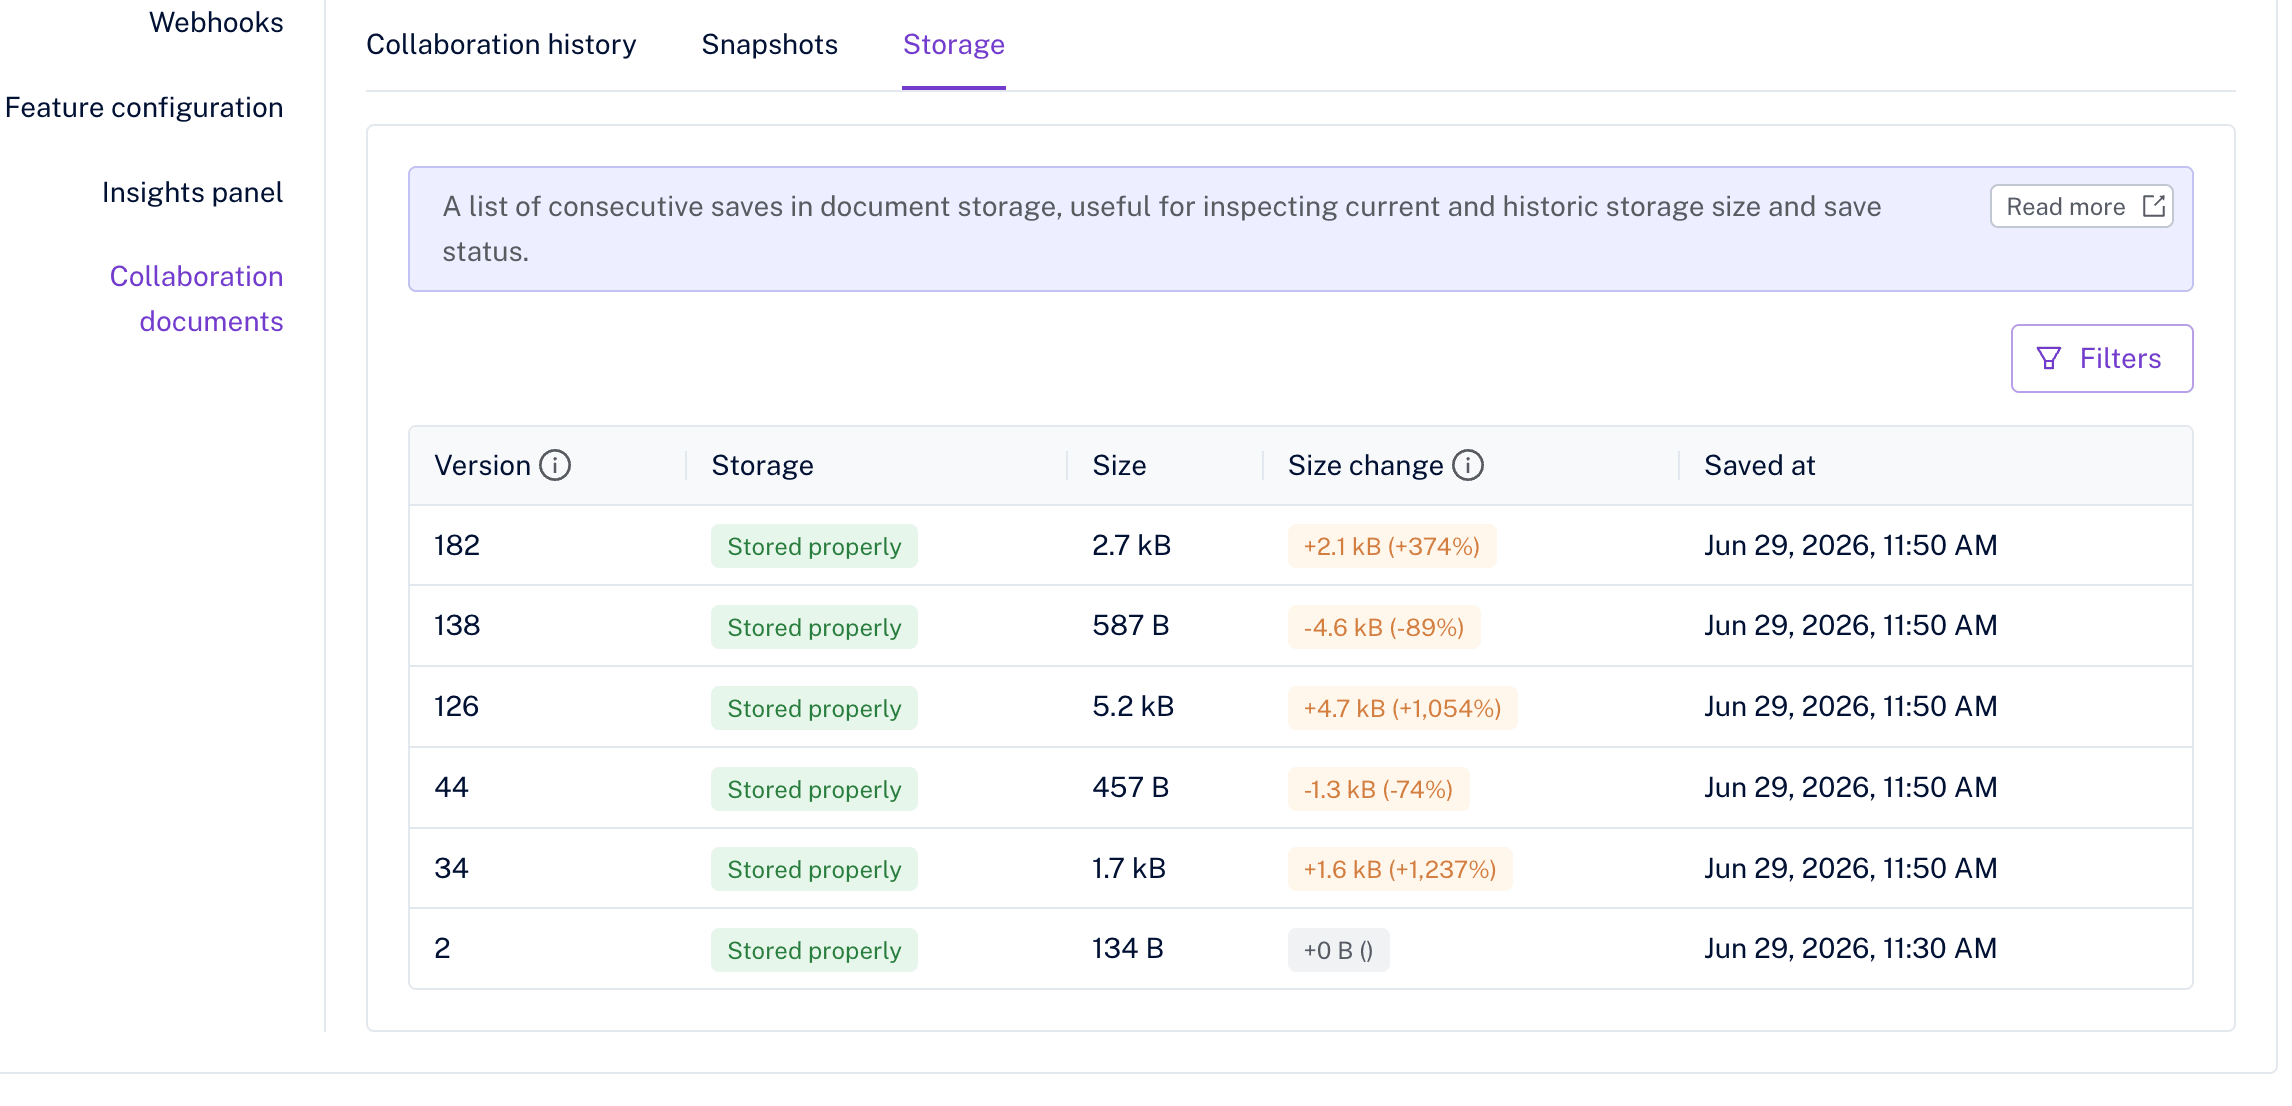
A Not stored properly status (highlighted in red) indicates a failed save – the document could not be persisted to storage. Hover over the status to see the recorded reason for the failure, so you can tell what went wrong without digging through the logs. A common cause is a missing or incompatible editor bundle, which document storage relies on; see features that require the editor bundle for what to upload and why.
The Size change column shows how much the document size changed compared with the previous save, which is useful for spotting anomalies. A large, unexpected jump may indicate content bloat – for example, an accidental bulk paste or a misbehaving plugin – while a sharp drop can point to accidental content loss. To surface such outliers across a document’s history, filter the list by a minimum or maximum size change range.
You can also filter saves by Storage status and narrow them to a time range with the From / To date pickers.