Requests logging
To get more insight into how the Collaboration Server is performing, we built logs that can be used for monitoring. To enable these, just add the ENABLE_METRIC_LOGS=true environment variable.
See the configuration for more variable details.
These are logs (metrics) that are always logged with level = 30 (even if the request returns an error). They are printed for all synchronous requests (HTTP and WebSockets). In the case of these logs, you must rely on the status or statusCode properties to detect any anomaly.
Meaning of statuses:
success– request responses with status codes<399warning– request responses with status codes≥400and<499fail– request responses with status codes≥500
The log structure contains the following information:
handler– A unified identifier of action. Use this field to identify calls.traceId– A unique RPC call ID.tags– A semicolon-separated list of tags. Use this field to filter metrics logs.data– An object containing additional information. It might vary between different transports.data.duration– The request duration in milliseconds.data.transport– The type of the request transport. It could behttporws(websocket).data.status– The request status. It can be equal tosuccess,fail,warning.data.statusCode– The response status in the HTTP status code standard.
Additionally, for the HTTP transport, the following information is included:
data.url– The URL path.data.method– The request method.
In case of an error, data.status will be equal to failed and data.message will contain the error message.
An example log for HTTP transport:
{
  "level": 30,
  "time": "2021-03-09T11:15:09.154Z",
  "msg": "Request summary",
  "handler": "v5:GET:collaborations:id:exists",
  "traceId": "bd77768c-4f49-44da-b658-f765340ea643",
  "data": {
    "duration": 32,
    "transport": "http",
    "statusCode": 200,
    "status": "success",
    "url": "/api/v5/e2e-58a48a5ba8521b6f/collaborations/e2e-eff1945d39894534/exists",
    "method": "GET"
  },
  "tags": "metrics"
}
An example log for WS transport:
{
  "level": 30,
  "time": "2021-03-09T13:11:52.068Z",
  "msg": "Request summary",
  "handler": "addComment",
  "traceId": "db09ba44-cb96-4db6-84f0-59eb3691b193",
  "data": {
    "duration": 12,
    "transport": "ws",
    "status": "success",
    "statusCode": 200
  },
  "tags": "metrics"
}
This information will give you the overall number of requests handled by the Collaboration Server split by transport (WebSockets and HTTP).
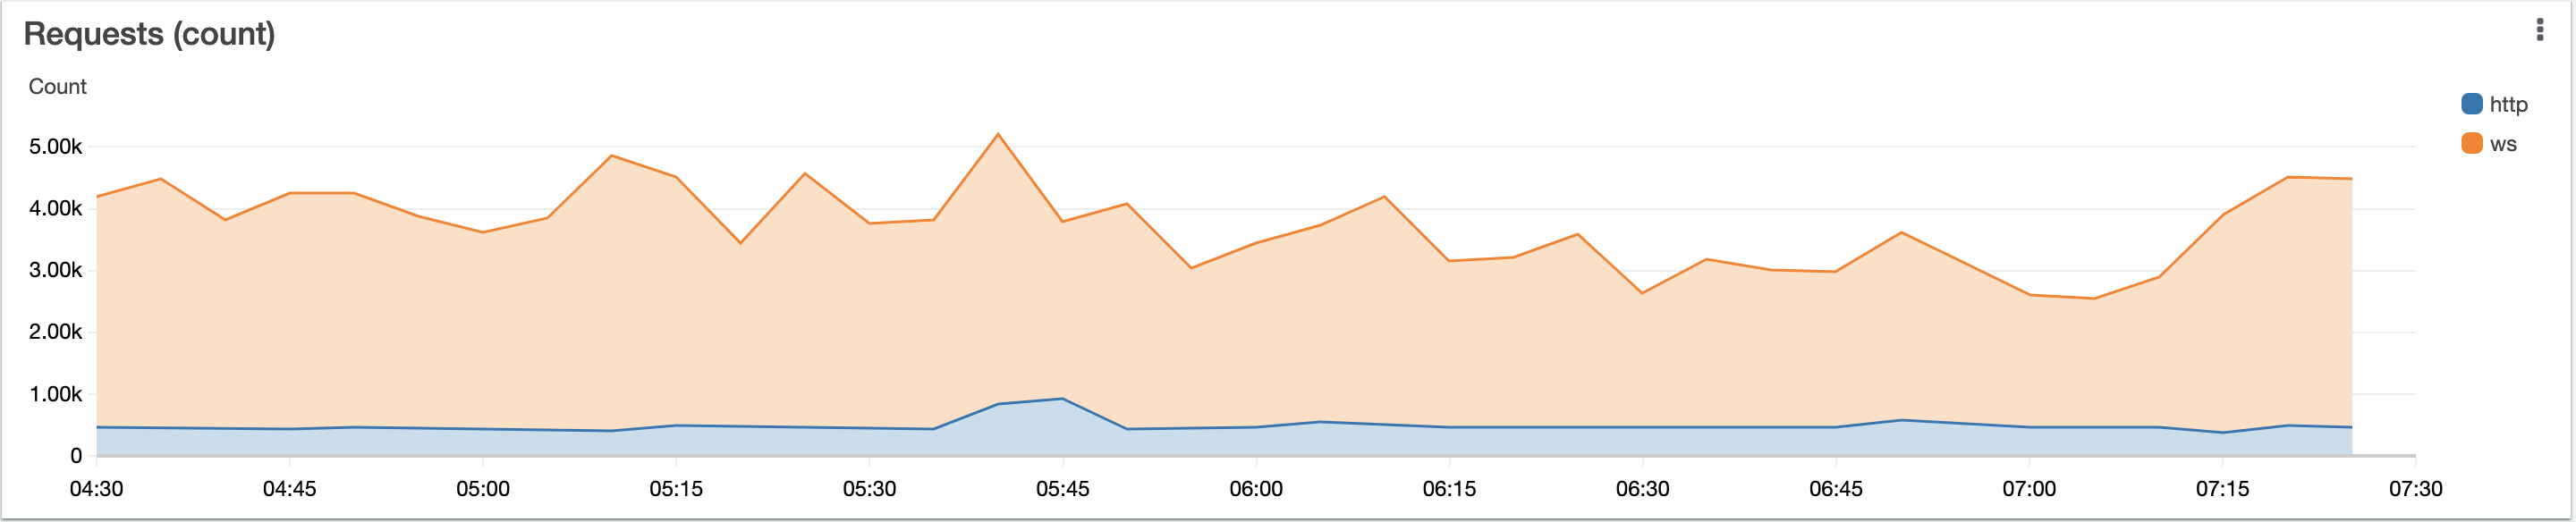
Use the data.transport field to distinguish between different request types.
This chart will show how fast requests are per specific operation, which is very useful for measuring user experience as well as debugging.
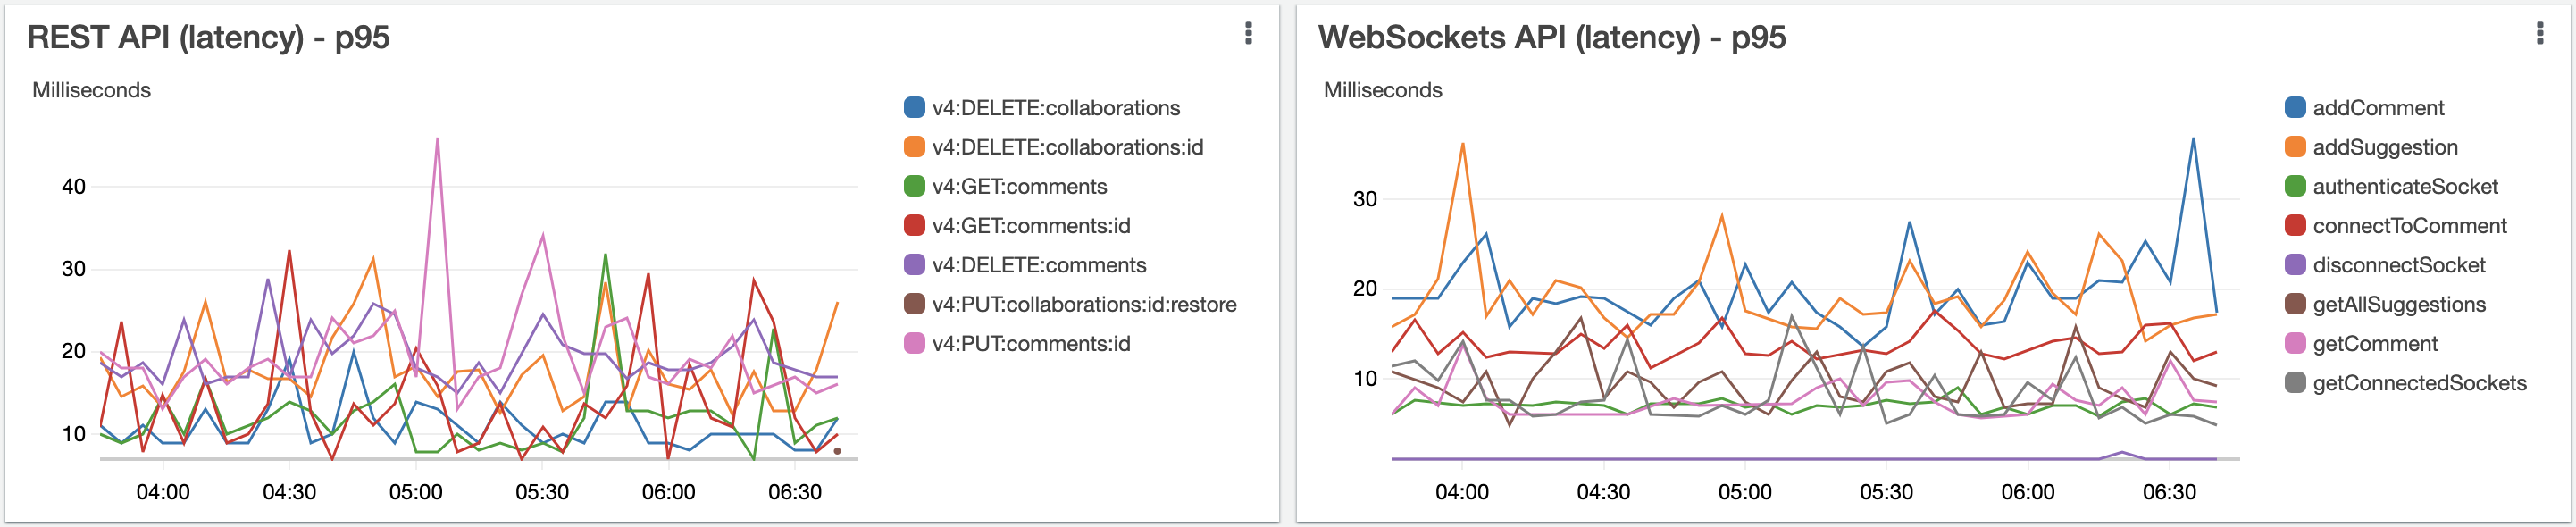
Use the data.duration and handler fields to measure request latency of operations.
Display number of failures (5xx codes) per operation type.
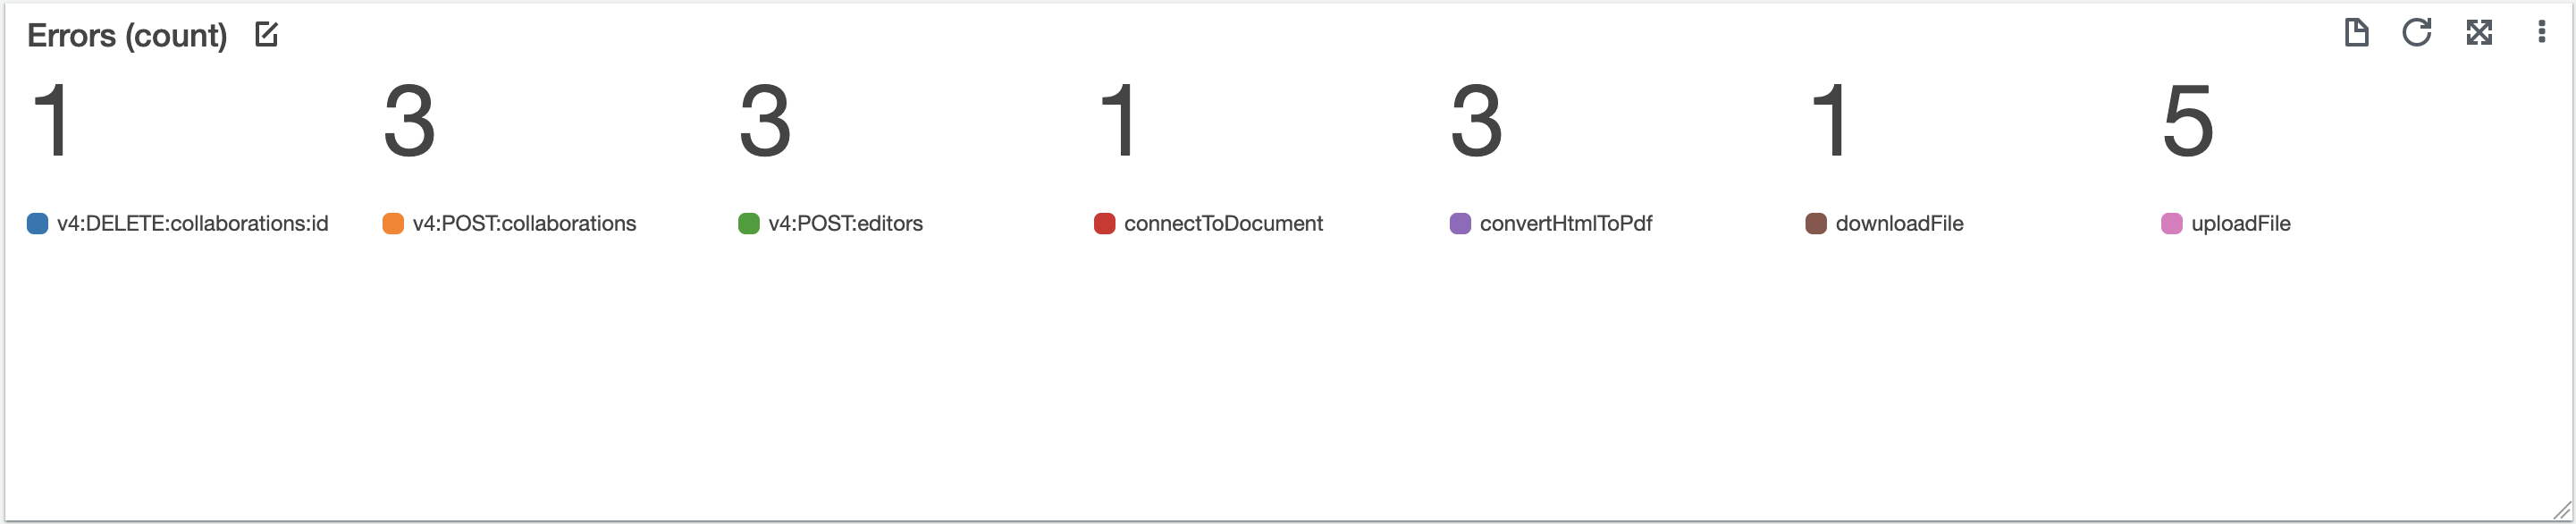
Use the handler and data.status fields to count failures of operations.
Display number of warnings (4xx codes) per operation type. This information is very useful especially for debugging the system performance issues.
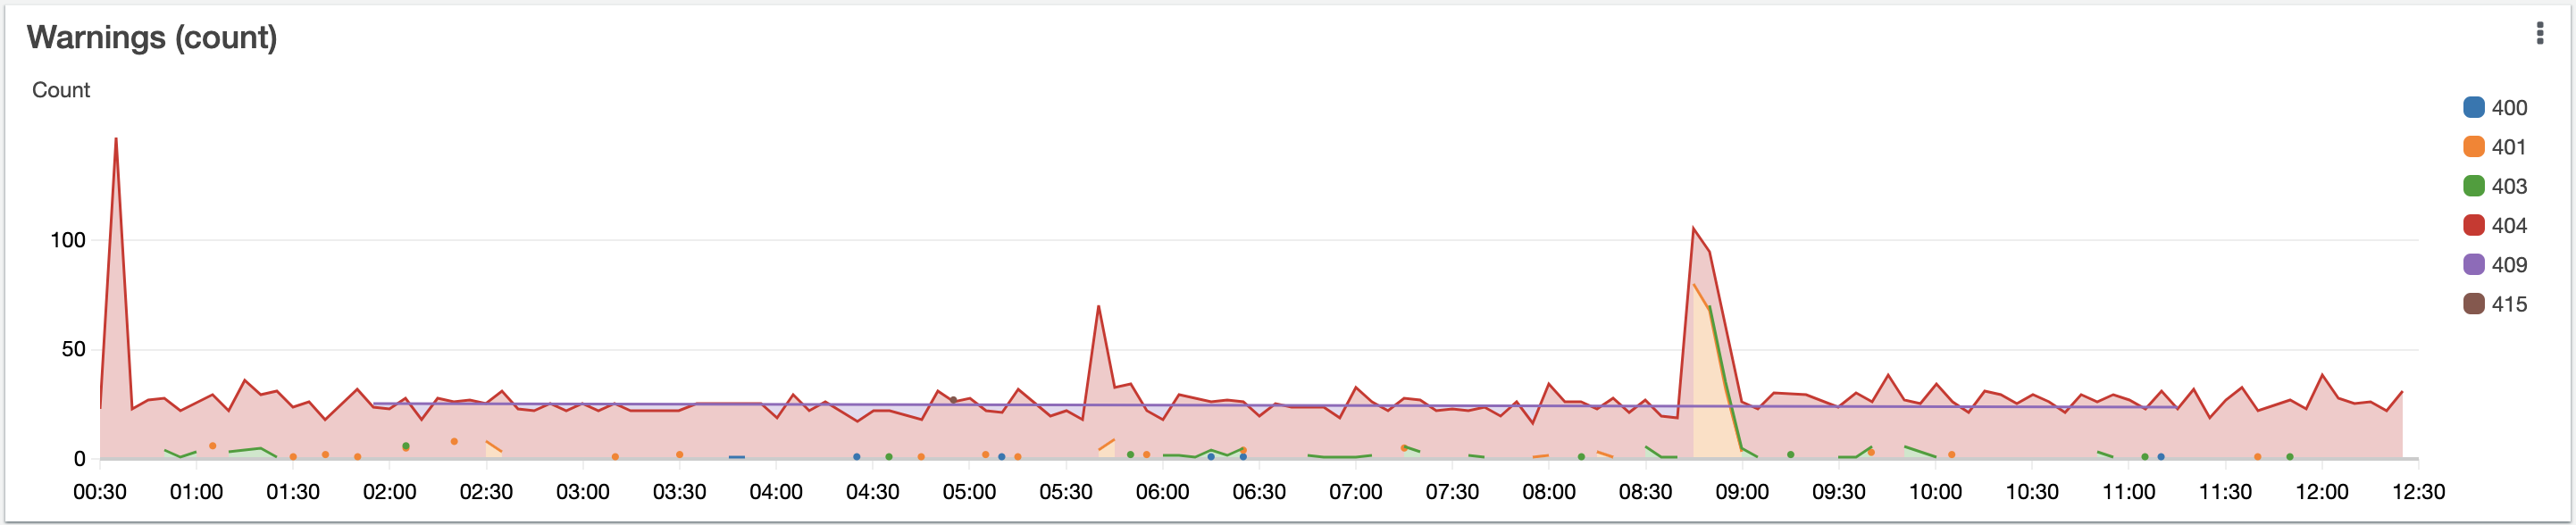
Use the data.status and data.statusCode fields to count incorrect requests and their types.