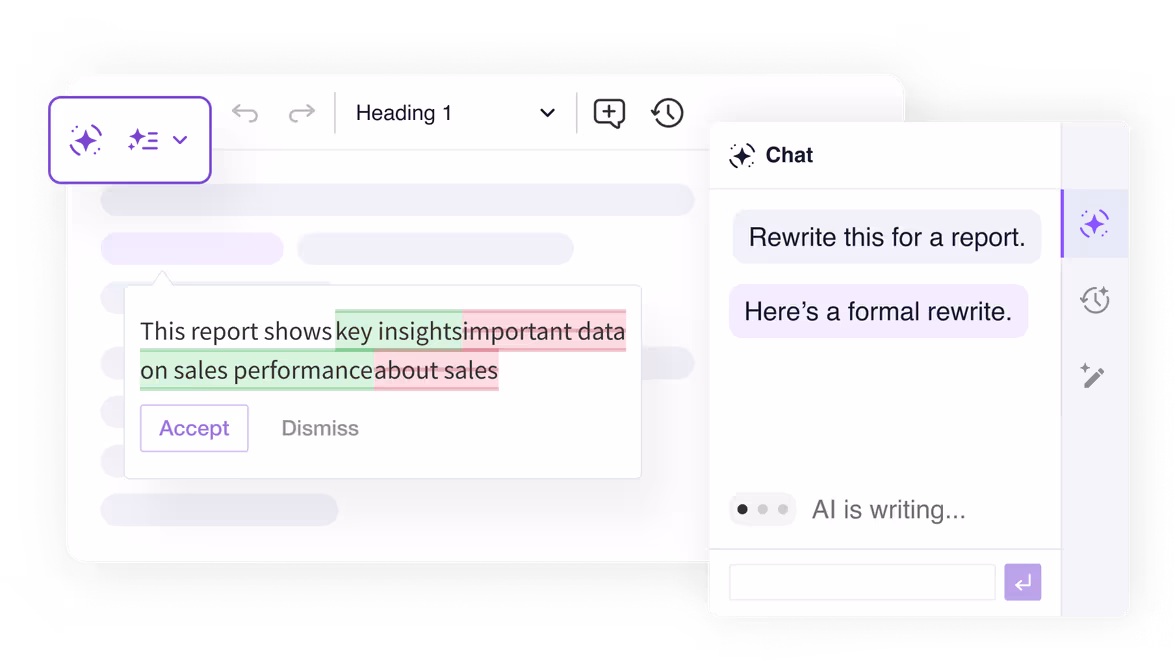
All four features run directly in the Classic editor via a side panel – no separate tool or window needed. Select a tab below to try each one live.
An example setup combining CKEditor AI with the Classic editor. Chat with AI, review your writing, and apply Quick Actions, all in a familiar editing experience. For the full range of AI and editor features, visit the full-featured AI demo.
Customer Support Metrics Report
Operational Summary – Second Half of 2025
Overview
This report summarizes customer support performance during the second half of 2025. It focuses on ticket volumes, response efficiency and common issue categories, based on internal operational data across all support channels.
The information below should be treated as an overview of observed trends rather than a detailed performance evaluation.
Support Process Overview
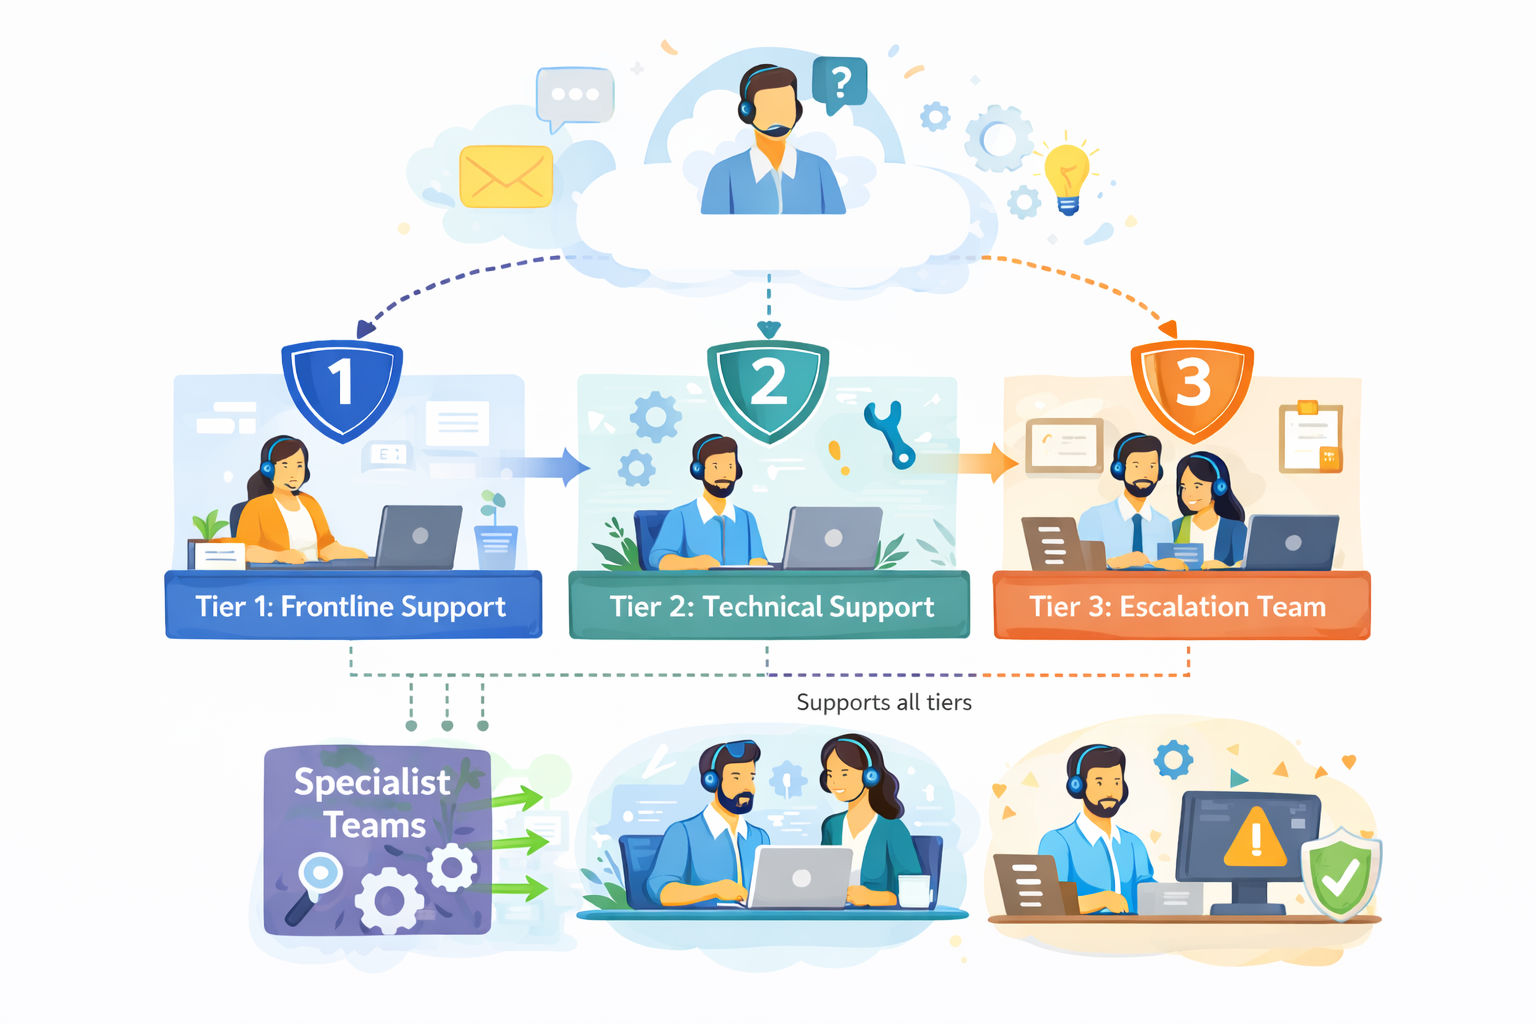
The diagram outlines our internal customer support process, showing how incoming requests are handled across multiple support tiers based on complexity.
Customer inquiries are initially managed by Tier 1: Frontline Support, which is responsible for triage and resolution of common issues. More complex cases are escalated to Tier 2: Technical Support, where deeper technical investigation is performed.
High-impact or unresolved issues are handled by Tier 3: Escalation Team, which coordinates with internal experts as required. Specialist Teams support Tier 2 and Tier 3 by providing domain-specific expertise, while typically remaining non-customer-facing.
The process is designed to allow flexible movement between tiers, supporting efficient resolution and appropriate escalation when needed.
Ticket Volume
During the reporting period, the support team processed 184,600 tickets, representing an increase of 11% compared to the previous period. Ticket volume peaked in September and gradually stabilized towards the end of the year.
The increase was primarily driven by onboarding-related questions and product configuration requests.
Channel Distribution
| Channel | Share of Tickets | Change vs. Previous Period | Avg. First Response Time |
|---|---|---|---|
| 54% | -3% | 3.1 hours | |
| Live Chat | 31% | +5% | 1.2 hours |
| In-App Support | 15% | -2% | 2.4 hours |
Email remained the dominant support channel, although live chat usage continued to increase, particularly among larger accounts.
Resolution Efficiency
Average response and resolution times showed minor improvement compared to earlier in the year.
- Average first response time: 2.4 hours
- Average resolution time: 18.7 hours
- Tickets resolved within 24 hours: 68%
More complex cases, especially those related to integrations, required additional follow-up and were not consistently resolved within standard timeframes. While faster response times were generally appreciated, qualitative feedback indicates that communication consistency played an equally important role in overall customer perception.
"Faster responses were helpful, but consistency in follow-up communication had a bigger impact on our overall experience."
— Enterprise customer, post-resolution survey
Common Issue Categories
The most frequently reported issues were:
- Account access and authentication
- Billing and invoice related questions
- Feature usage clarification
- Integration setup
- Performance-related concerns
Billing-related requests declined slightly, while integration-related inquiries increased towards the end of the period.
Customer Satisfaction
Customer satisfaction was measured through post-resolution surveys. The overall response rate remained stable throughout the reporting period.
- Average CSAT score: 4.2 / 5
- Survey response rate: 27%
Feedback most often referenced response time and clarity of follow-up communication as areas for improvement, particularly in cases involving multiple handovers or escalations.
Identified Bottlenecks
Internal review identified several operational areas that may require further attention:
- Delays in ticket reassignment for escalated cases
- Inconsistent categorization of incoming requests
- Limited coverage during selected regional peak hours
While these issues did not materially impact aggregate performance metrics, they were visible in individual case handling and customer feedback.
"The issue was eventually resolved, although it was not always clear who was responsible for the case during escalation."
— Key account feedback, quarterly review
Summary
Overall support performance remained within expected operational ranges. Most key indicators were stable, with moderate improvements observed in response efficiency. At the same time, the data suggests that further improvements in communication clarity and escalation handling could positively impact customer experience in future reporting periods.
Explore the AI Chat side panel to ask questions, generate content, and fill templates using real data. Use chat shortcuts to jump straight into common tasks that pull results through web search, or attach your own context from the dropdown to ground AI responses in your source data. Switch between conversations with chat history. For the full range of AI features, visit the full-featured AI demo.
Report Summary
[Title]
A clear, customer-oriented headline based on the report
[Subtitle]
A short sentence explaining what this summary covers
1. What This Report Is About
A short overview of the topic covered in the report and the main areas it focuses on.
2. Key Takeaways
- Key takeaway #1: [Main insight expressed clearly]
- Key takeaway #2: [Important trend or finding]
- Key takeaway #3: [Insight with practical relevance]
3. What the Data Shows
- [Data point #1]: [Value] — [Short interpretation]
- [Data point #2]: [Value] — [Why it matters]
- [Data point #3]: [Value] — [Practical implication]
4. What This Means for Companies
A short section explaining how these findings affect companies, teams, organizations, or customers in practice.
5. Looking Ahead
A brief forward-looking paragraph based on the report’s insights and observed trends.
6. About the Report
A short description of the source report and what it explores.
Select any text and apply instant AI transformations: rewrite, fix grammar and spelling, change tone, adjust length, translate, or continue writing. Use the hints in the content below to try each action hands-on. For the full range of AI features, visit the full-featured AI demo.
QA: From Hype to Everyday Reality
From Hype to Everyday Reality: How AI Has Evolved in Recent Years
👉 Hint: This paragraph is too short. Select it and use AI Quick Actions: Adjust length → Make longer
1. The Acceleration Moment
AI grew fast. Very fast.
👉 Hint: This paragraph has many grammar and spelling mistakes. Select it and use AI Quick Actions: Fix grammar & spelling
2. From Narrow Tools to Versatile Assistants
Early AI system was design for one task only and they does not work very good. Today model are more better and can do many thing at same time like writing, image make, data analyze and talk with people which is not always accurate and sometime confusing and peoples use it anyway without thinking.
👉 Hint: This paragraph sounds unfriendly. Select it and use AI Quick Actions: Change tone → More friendly
3. AI Enters Everyday Life
AI is now embedded everywhere and users are expected to adapt to it whether they like it or not. Businesses implement AI tools primarily for efficiency, often with little regard for learning curves or individual comfort, making interaction feel more like obligation than support.
👉 Hint: This paragraph is not in English. Select it and use AI Quick Actions: Translate → English
4. New Questions and New Responsibilities
En los últimos años, la discusión sobre la inteligencia artificial ha cambiado mucho. Ya no se trata solo de innovación, sino también de ética, privacidad y control, y muchas personas no confían plenamente en cómo se está utilizando esta tecnología.
👉 Hint: This paragraph contains many items in a long sentence. Select it and use AI Quick Actions: Other → Convert to bullet points
5. AI Across Industries
AI is reshaping healthcare, education, finance, marketing, customer service, logistics, entertainment, scientific research, software development, cybersecurity, manufacturing, and public administration, showing that its influence is no longer limited to experimental labs or tech companies but is becoming part of nearly every sector of modern life.
👉 Hint: This paragraph is unfinished. Select it and use AI Quick Actions: Continue writing
6. Looking Ahead
The future of AI will certainly continue to evolve in unpredictable ways and it will probably lead to changes that we cannot fully understand yet because the pace of development is so fast that many experts believe
Run predefined reviews like Proofread, Improve clarity, or Adjust Tone. You can also enter a custom command for any specific check. The Company style guide shown here is an example of a custom, integrator-defined review preset, and you can create your own to match your organization's standards. For the full range of AI features, visit the full-featured AI demo.
FIX ERRORS: Executive Summary
Executive Summary — Quarterly Business Update
This is a first draft of a quarterly executive summary, written under time pressure.
Review the text below and improve its grammar, clarity, and flow, while keeping a concise, executive-level tone.
Use AI Review to improve wording and correct mistakes.
Executive Summary (Draft)
Overall, this quarter can be described as rather positive for the company, even though not all areas performed according to what we was initially expecting when the quarter started. The general direction is good, but there are several points that require more attention going forward.
Revenue was higher than in previous quarter, mainly driven by existing customers who expanded their contracts, as well as few new enterprise deals which was signed close to the end of the quarter. However, this growth was partially offset by increased costs, especially in hiring and infrastructure, which ended up being higher then planned.
From the customer perspective, retention remains on a good level and churn did not increased significantly. At the same time, we are seeing early signs of decreasing engagement in some customer segments, especially among mid-sized clients. This is something that could become an issue in next quarters if not addressed on time.
Product development made solid progress, although some initiatives was delayed due to resource constraints and shifting priorities during the quarter. This impacted delivery timelines and required additional coordination across teams, which also had impact on productivity.
In summary, the quarter results are acceptable and show that the business is moving in the right direction. That said, the outlook for the next quarter is more uncertain, mostly due to external market conditions and increased pressure on margins. Our ability to execute on planned initiatives and control costs will be critical to achieve the expected results.
Curious how this would sound written differently? Ask AI.
Translate your entire document into any supported language with a single click. AI analyzes the content and proposes translations shown directly in the editor, while the original text appears in the sidebar for easy comparison. Review them side by side, and accept the translation when you're satisfied. For the full range of AI features, visit the full-featured AI demo.
Customer Support Metrics Report
Operational Summary – Second Half of 2025
Overview
This report summarizes customer support performance during the second half of 2025. It focuses on ticket volumes, response efficiency and common issue categories, based on internal operational data across all support channels.
The information below should be treated as an overview of observed trends rather than a detailed performance evaluation.
Support Process Overview
The diagram outlines our internal customer support process, showing how incoming requests are handled across multiple support tiers based on complexity.
Customer inquiries are initially managed by Tier 1: Frontline Support, which is responsible for triage and resolution of common issues. More complex cases are escalated to Tier 2: Technical Support, where deeper technical investigation is performed.
High-impact or unresolved issues are handled by Tier 3: Escalation Team, which coordinates with internal experts as required. Specialist Teams support Tier 2 and Tier 3 by providing domain-specific expertise, while typically remaining non-customer-facing.
The process is designed to allow flexible movement between tiers, supporting efficient resolution and appropriate escalation when needed.
Ticket Volume
During the reporting period, the support team processed 184,600 tickets, representing an increase of 11% compared to the previous period. Ticket volume peaked in September and gradually stabilized towards the end of the year.
The increase was primarily driven by onboarding-related questions and product configuration requests.
Channel Distribution
| Channel | Share of Tickets | Change vs. Previous Period | Avg. First Response Time |
|---|---|---|---|
| 54% | -3% | 3.1 hours | |
| Live Chat | 31% | +5% | 1.2 hours |
| In-App Support | 15% | -2% | 2.4 hours |
Email remained the dominant support channel, although live chat usage continued to increase, particularly among larger accounts.
Resolution Efficiency
Average response and resolution times showed minor improvement compared to earlier in the year.
- Average first response time: 2.4 hours
- Average resolution time: 18.7 hours
- Tickets resolved within 24 hours: 68%
More complex cases, especially those related to integrations, required additional follow-up and were not consistently resolved within standard timeframes. While faster response times were generally appreciated, qualitative feedback indicates that communication consistency played an equally important role in overall customer perception.
"Faster responses were helpful, but consistency in follow-up communication had a bigger impact on our overall experience."
— Enterprise customer, post-resolution survey
Common Issue Categories
The most frequently reported issues were:
- Account access and authentication
- Billing and invoice related questions
- Feature usage clarification
- Integration setup
- Performance-related concerns
Billing-related requests declined slightly, while integration-related inquiries increased towards the end of the period.
Customer Satisfaction
Customer satisfaction was measured through post-resolution surveys. The overall response rate remained stable throughout the reporting period.
- Average CSAT score: 4.2 / 5
- Survey response rate: 27%
Feedback most often referenced response time and clarity of follow-up communication as areas for improvement, particularly in cases involving multiple handovers or escalations.
Identified Bottlenecks
Internal review identified several operational areas that may require further attention:
- Delays in ticket reassignment for escalated cases
- Inconsistent categorization of incoming requests
- Limited coverage during selected regional peak hours
While these issues did not materially impact aggregate performance metrics, they were visible in individual case handling and customer feedback.
"The issue was eventually resolved, although it was not always clear who was responsible for the case during escalation."
— Key account feedback, quarterly review
Summary
Overall support performance remained within expected operational ranges. Most key indicators were stable, with moderate improvements observed in response efficiency. At the same time, the data suggests that further improvements in communication clarity and escalation handling could positively impact customer experience in future reporting periods.
Explore AI Chat connected to Airtable through MCP to ask questions, retrieve records, and use real business data directly in the editor. Fill templates and ground responses in structured external data without leaving the editing experience. For the full range of AI features, visit the full-featured AI demo.
[Company name]
A concise internal summary of the target company based on Airtable records.
1. Executive summary
A short overview of the company, what it does, and why it may be relevant as an acquisition target.
2. Company profile
- Industry: [Industry]
- Location: [Location]
- Founded: [Founded date]
- Employees: [Employee count]
- Ownership structure: [Ownership structure]
- Status: [Company status]
3. Financial snapshot
- Annual revenue: [Annual revenue]
- Key financials: [Key financials]
4. Strategic rationale
Explain why this company may be an attractive target based on its sector, scale, market position, and business profile.
5. Key contacts and supporting materials
Summarize which people may be most relevant for the next step in diligence.
An example setup combining CKEditor AI with the Balloon Block editor and a custom panel. Instead of a fixed sidebar, every AI tool is available from a floating assistant button in the bottom-right corner . Click it to open a compact panel with Chat, Quick Actions, and Review as horizontal tabs. For the full range of AI features, visit the full-featured AI demo.
🤯 Mind-Blowing AI Facts
Artificial Intelligence has evolved from science fiction fantasy to an integral part of our daily lives. Behind the scenes, fascinating developments are happening at breakneck speed, reshaping industries and challenging our understanding of what machines can accomplish. From detecting diseases faster than doctors to composing symphonies that move audiences to tears, AI continues to surprise us with its capabilities.
⚡ Shocking AI Statistics
The numbers behind artificial intelligence are truly staggering. Consider this: every minute, AI processes more data than the entire human civilization created in the first 5,000 years of recorded history!
- 💰 $15.7 trillion - predicted AI contribution to global economy by 2030
- 🔍 97% accuracy in medical image diagnosis (beating human radiologists)
- ⚡ 0.3 seconds - time needed to analyze a chess position with 35 pieces
- 🎵 1 million songs composed by AI every day across various platforms
- 🌍 40+ languages can be translated in real-time with 95% accuracy
"By 2025, machines will be capable of learning faster than a 5-year-old child. By 2030, they might surpass the learning speed of university graduates." - MIT Technology Review
🎨 AI in Creative Industries
| Industry | AI Achievement | Human vs AI | Year Achieved |
|---|---|---|---|
| 🎬 Film | Entire movie script generated | AI: 72h, Human: 6 months | 2023 |
| 🖼️ Art | Painting sold for $432,500 | AI artwork at Christie's | 2018 |
| 📚 Literature | Novel passed literary contest | Fooled human judges | 2022 |
| 🎵 Music | Symphony performed by orchestra | Indistinguishable from Bach | 2021 |
🔬 Scientific Breakthroughs
AI's impact on scientific discovery is nothing short of revolutionary. Here are some game-changing achievements:
- 🧬 Protein folding solved - AlphaFold predicted 200M+ protein structures
- 🌌 Dark matter detected - AI found patterns invisible to human astronomers
- 💊 Drug discovery accelerated - 10 years reduced to 6 months
- 🌡️ Climate modeling enhanced - 1000x more accurate weather predictions
- 🔬 Materials science revolution - new compounds discovered weekly
🤯 Bizarre AI Capabilities
Some AI achievements sound like they belong in a sci-fi movie, but they're happening right now:
- 🐕 Pet emotion recognition - AI can tell if your dog is happy or stressed
- 👶 Baby cry translation - determines if infant needs food, sleep, or diaper change
- 🪴 Plant health diagnosis - identifies diseases from a single leaf photo
- 🎭 Emotion synthesis - generates facial expressions that don't exist in nature
- 🧠 Dream interpretation - reconstructs images from brain activity during sleep
Fun Fact: GPT-3 has 175 billion parameters - that's roughly equivalent to having 175,000 copies of the entire English Wikipedia stored in its neural pathways! 🤓
🚀 The Future is Closer Than You Think
What seemed impossible yesterday becomes reality tomorrow. AI is not just changing technology—it's redefining human potential and opening doors to possibilities we never imagined. From curing rare diseases to exploring distant galaxies, artificial intelligence continues to push the boundaries of what's achievable.
The most exciting part? We're only at the beginning of this incredible journey. Every day brings new discoveries, breakthrough innovations, and mind-bending applications that make the future feel wonderfully unpredictable! 🌟✨
This demo contains just a small subset of available CKEditor features. You are free to add more features to CKEditor regardless what editor type/toolbar you choose.
Read more about the AI capabilities in the documentation.
Check the source code for this demo.