Basic overview of creating flowcharts using Mermaid

What is Mermaid?
Mermaid is a flowchart and diagram visualization tool based on JavaScript and uses syntax inspired by Markdown in order to create and dynamically modify flowcharts. What Mermaid did with its recent release and availability on GitHub is replace the need to add screenshots or just code snippets within the GitHub text fields. Now visual charts can appear if you know how to create them and here we offer you a quick guide in order to create interesting and captivating charts. It is also available outside of GitHub as the brief installation section below shows.
Purpose of Guide
In this guide we will help you to navigate the Mermaid language or syntax used in order to create different flowcharts using Mermaid inside of GitHub or other sources you run it. It is similar to and inspired by Markdown, and Markdown supports language-specific code blocks. Thus, adding Mermaid diagrams is done using code blocks specifies mermaid as the language identifier.
Installation
Mermaid is working out of the box in GitHub text fields. However, to test it out or run it elsewhere there are four methods:
- Using the Mermaid Live Editor that is located at mermaid.live
- Using mermaid plugins with software you are familiar with
- Calling the Mermaid JavaScript API
- Deploying Mermaid as a dependency
The Live Editor is a good place to start experimenting and learning how to use the Mermaid syntax and is good enough for most use cases at least as a first introduction to it. Of course, you can do this in GitHub text fields as well.
Different forms of Mermaid diagrams
Mermaid offers a variety of types of diagrams one can create using its Syntax. It even allows for different arrow types, multidirectional arrows, as well as linking to and from subgraphs. The types of diagrams one can form with Mermaid include a flowchart, sequence diagram, class diagram, state diagram, entity-relationship diagram, user journey, gantt, pie chart, requirement diagram, and some other examples like pie charts.
Here we will go into the most common and basic forms of flowcharts to get you started. To learn about the more complex types and more technical details, head over to the Mermaid guide on GitHub.
Flowchart
A flowchart is composed of nodes that are square-based and connected by lines with arrows. The inside of each square, aka node, can have any symbol, number, or line of text that the creator deems fit. One exception is to not use the word “End” within a flowchart node and use capitalization for the first letter to keep it from breaking and being consistent.
Below is a code block using the Mermaid identifier to create a simple flowchart. The code block shows the statement “flowchart“ (graph can also be used) identifying the flowchart and it being created in a top-down manner due to the statement “RD” within the code. Other options include LR, or left to right, BT, bottom to top, or RL, right to left.
flowchart TD;
    1-->2;
    2-->3;
    2-->3;
    3-->4;
The chart that this code creates links the nodes downward from starting from the top. To show some options with possibilities, I have also added two arrows pointing downwards from the number “2”, in order to show you how you can create interesting scenarios with the flow or arrows to other sections. The numbers can be replaced for other syntax like letters, so feel free to experiment with the code block above.

You take out one of the nodes that repeat and it removes the arrow.
flowchart TD;
    1-->2;
    2-->3;
    3-->4;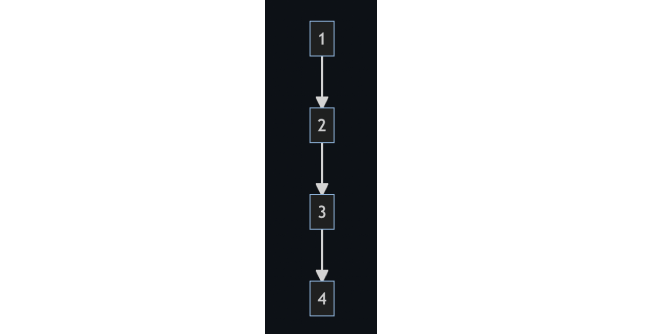
Here is a code block using letters and shows a more circular flowchart:
graph TD;
    A-->B;
    A-->C;
    B-->E;
    C-->E;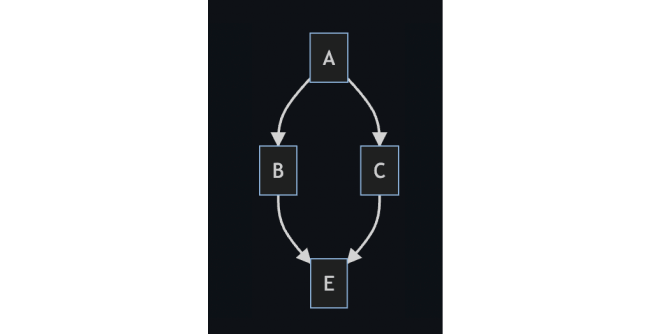
In the above code block we want to give A two options: B or C. However, we want to redirect both B and C to E (you can use D here or anything you like, but this is for our purposes only) so the arrows do a loop. Now below, we can continue this circle to more of a flowchart and create D from E or redirect E down to D:
graph TD;
    A-->B;
    A-->C;
    B-->E;
    C-->E;
    E-->D;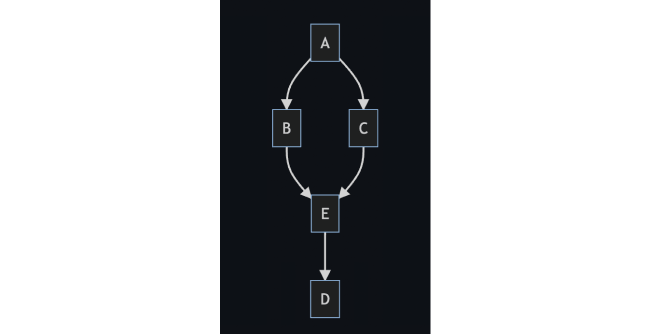
Let us look at a flowchart with a left to right orientation. If we for example use the same syntax as the flowchart above, but replace “TD” with “LR” we get this:
graph LR;
    A-->B;
    A-->C;
    B-->E;
    C-->E;
    E-->D;
This in turn results in this graph being displayed:

Node modifications
Nodes can be modified in different ways. Below is a basic node of a flowchart being displayed in its basic form. “Id” stands for what is going to be displayed in the box or node:
flowchart LR
    Id
Here is a node with a rounded age displaying the same as above:
flowchart LR
    Id1(id)
As you see, you have to change the simple “id” or identifier to “id1” and put the actual text inside the parenthesis to match the text of “id”.
There are many more options of node creation. They range from stadium-shaped nodes to circular and cylindrical-shaped nodes. For the specific code, see the node shapes section of the GitHub read me.
Arrow modifications
The arrows or links connecting the nodes can also be altered in different ways. The basic syntax of an arrow is this:
flowchart RL
    A-->B
Here is a line linking the same two nodes also from a right-to-left fashion and without an arrow even present:
flowchart RL
    A---B
As you see, all you had to do is replace the arrow or greater-than symbol with another hyphen.
You can even have a line replaced with text as the link. Below is such an example:
flowchart LR
 A-- put the text here you want to ---B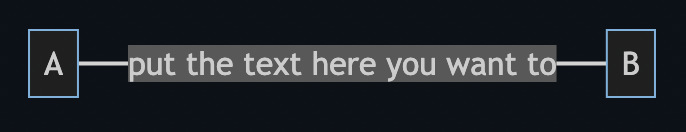
There are many more options, such as dotted lines as the link lines or a thicker line and arrow. For more see the more in-depth guide on the subject.
Arrow types
You can modify the type of arrow that a link will be using as well with a couple options available. For instance the code below shows one link having an “o” for an arrow and the other a “+” sign:
flowchart LR
    A --o B
    B --x C
Multi-directional arrows are also possible showing either an arrow or another symbol pointing both ways. Here is an example:
flowchart LR
    1 o--o 2
    2 <--> 3
    3 x--x 4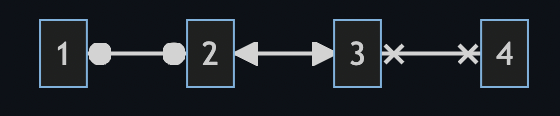
Chaining of links
Links can be chained together or written on the same line of code. Here is an example:
flowchart LR
   1 -- first link --> 2 -- second link --> 3
It is also possible to declare a node going to different nodes through links in various ways as the example below shows:
flowchart LR
   a --> b & b--> c
Here is another example showing a different flowchart take place after the chaining of links on a single line of code:
flowchart LR
   a --> b & c--> d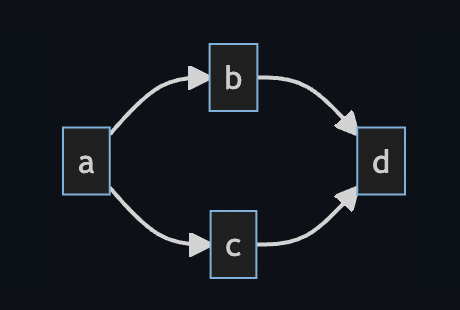
Sometimes you will need to play around with the chaining or experiment to see what will result instead of trying to predict it, but the overall code should follow from the first node or in the case above from the node “a” to both “b” and “c” but not “d” since “c” goes to “d”.
In fact, you can declare dependencies in a specific way pointing from one node to specific other nodes and more nodes on a single line pointing to other nodes. Here is an example:
flowchart TB
    1 & 2--> 3 & 4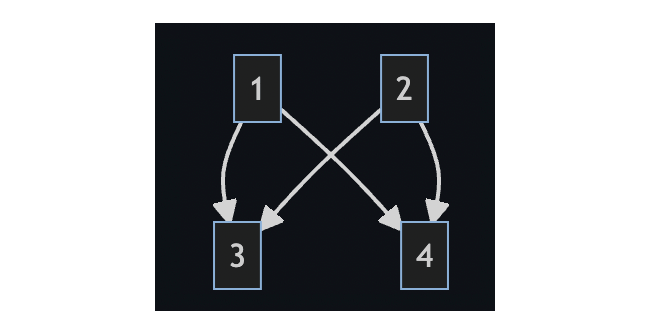
As you see from the code of the dependency, both “1” and “2” is directed to point to “3” and “4”. This resulted in a bit of an awkward shape, but it follows this dependency.
Nodes assigned a ranking based on position
Depending on the direction of the flowchart, each node is assigned a rank on which level or how close to the top or first node it will be positioned. This depends on the node it is linked to.
In addition “start” and “end” statements can be made to make it easier for you or your readers to tell where a complex chart starts and ends. It is also possible to make a link longer by adding more dashes to it.
For example, take this example where a beginning or “start” node is clearly marked as well as an end node as “end”. Meanwhile, there are various choices or nodes pointing in different directions based on what the user chooses and follows. Notice, how the more text you put inside a node the larger it becomes.
flowchart TD
    A[start] --> B{second node asking a question}
    B -->|Yes| C[OK]
    C --> D[go back]
    D --> B
    B ---->|No| E[End]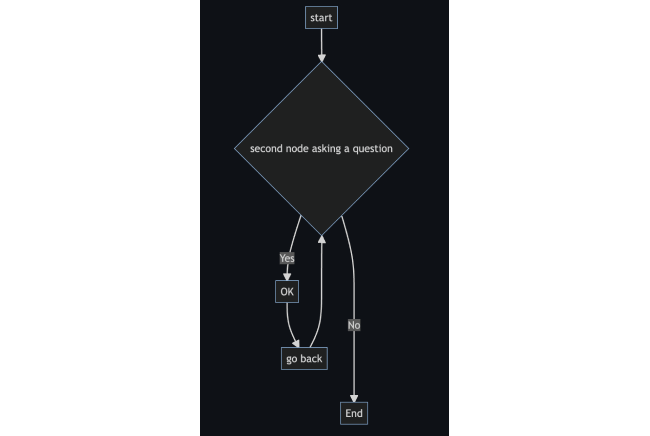
The reason the second node above is pointed the way it is and not a pure square like the other nodes is the bracket difference between “{ & }” and “[ & ]”. If you switch the brackets it will become square like the other nodes. Also to remind you, “No” is lower than “OK” due to having more dashes in its definition. Also, notice that second node, or one asking the question, points to both the “Yes” and “OK” nodes because it is directed on the same line of code from “B” and without having to have dashes showing this or a separate line of code. It may appear strange until you get used to the syntax and will need to play around with it. Here is what it actually would look like if you have it written the way one might think at first thought, totally changing the shape:
flowchart TD
    A[start] --> B[second node asking a question]
    B -->|Yes| -
    B --> C[OK]
    C --> D[go back]
    D --> B
    B ---->|No| E[End]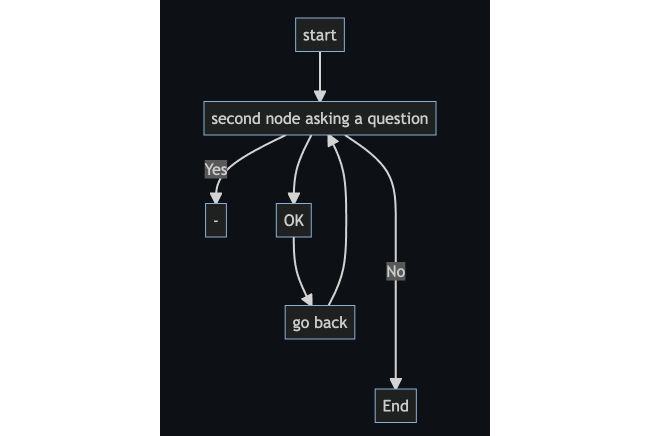
Notice that the second node or question was also changed to look the way the other ones in the example above. Again, this is done with a changing of the brackets or bracket types.
Avoiding breaking the syntax
You can avoid breaking syntax by using parenthesis around special characters that may confuse the rendering of the code. For example:
flowchart LR
    id1["This is the (special definition) in the node"]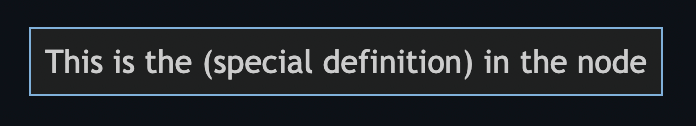
Below are some other examples of how to break the syntax code and form special characters within the nodes. The first shows how to add a quotation mark inside a node and the second a heart special character:
flowchart LR
       A["adding a quote:#quot;"] -->B["a heart char:#9829;"]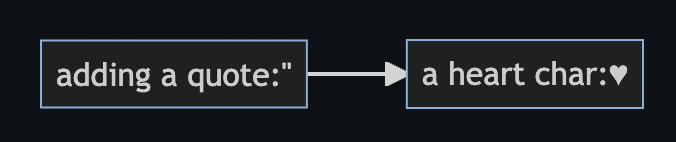
If you are familiar with HTML you can experiment with this approach and need specific or special characters added within the nodes.
Creating subgraphs or multiple subcharts
It is possible to have separate charts as part of one larger flowchart separated into subgraphs. Here is an example of such subgraphs:
flowchart TB
    a1-->c1
    subgraph A
    a1-->a2
    end
    subgraph B
    b1-->b2
    end
    subgraph C
    c1-->c2
    end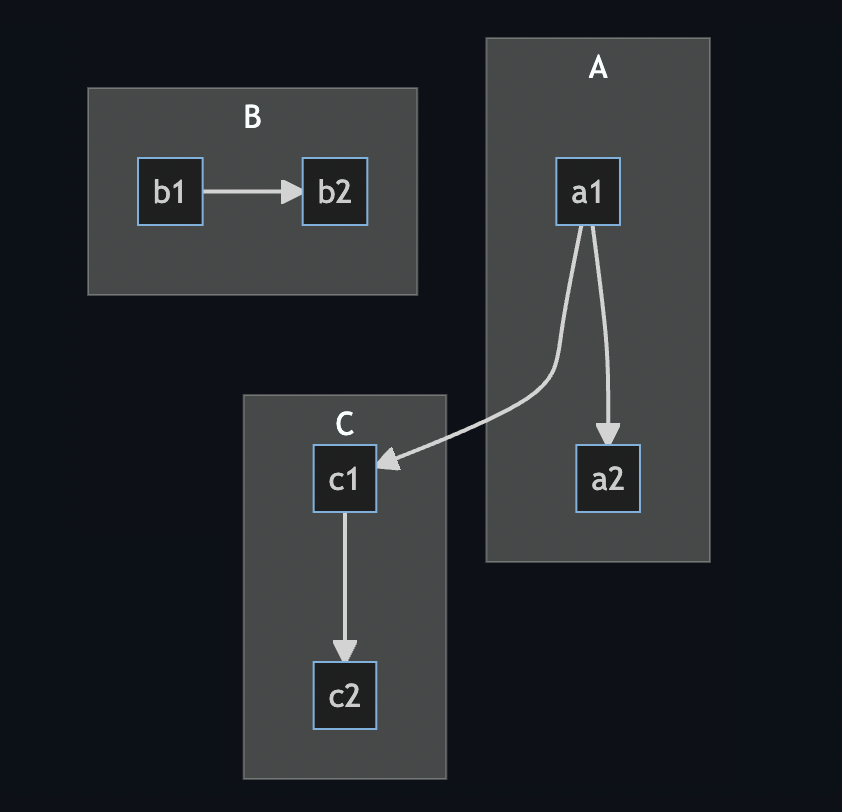
You see end statements above identifying when the subgraph ends and later a new one can be formed. In the beginning of the code block, “a1” is linked to “c1” thus showing you how you can link nodes across the subgraphs. It is also done before even a subgraph is mentioned or identified within the code block. You can experiment with this and create interesting links between the subgraphs and various nodes.
To sum it up
This is just a small taste of what is possible when creating flowcharts within Mermaid on GitHub or other places you want to run it. As previously mentioned, other possibilities include user journeys and pie charts and many more. If you want to learn more about creating flowcharts or more options in terms of what is possible or other types of graphs possible within Mermaid, head on over to the Mermaid guide on GitHub. However, this should get you started within GitHub in creating flowcharts for your users.