
 Insights panel
# Insights Panel – overview
The Insights Panel feature allows to gather, list and filter business (audit) logs that come from the CKBox Server. These logs provide a good insight into what is going on internally in your environments. Also, the Insights Panel serves as a useful debugging tool, especially during integration with the CKBox.
# Activating the Insights feature
By default, the Insights feature is turned off for all environments.
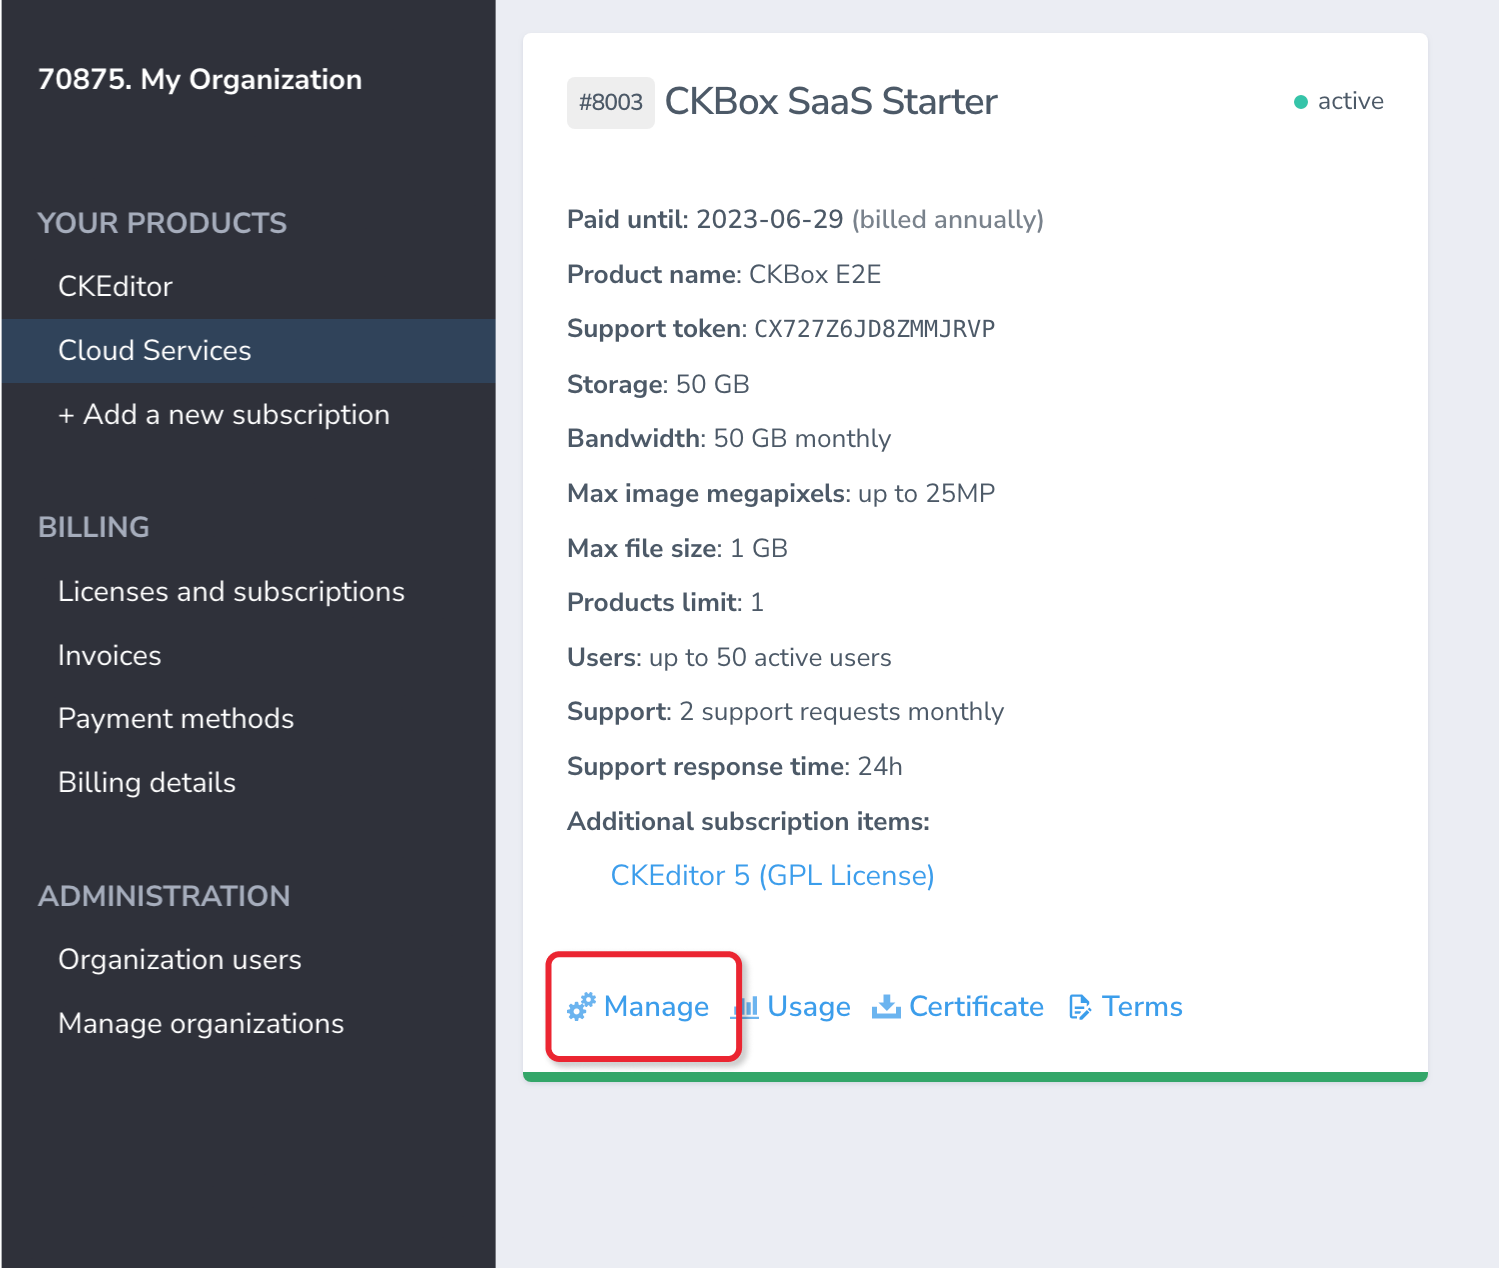
To activate the Insights feature, follow the steps below.
Log in to the Cloud Services Dashboard (Management Panel when using On-Premises) and go to the Feature configuration tab for the selected environment. Note that the feature is activated separately for every environment.
Under the INSIGHTS section, switch on the Business logs toggle.
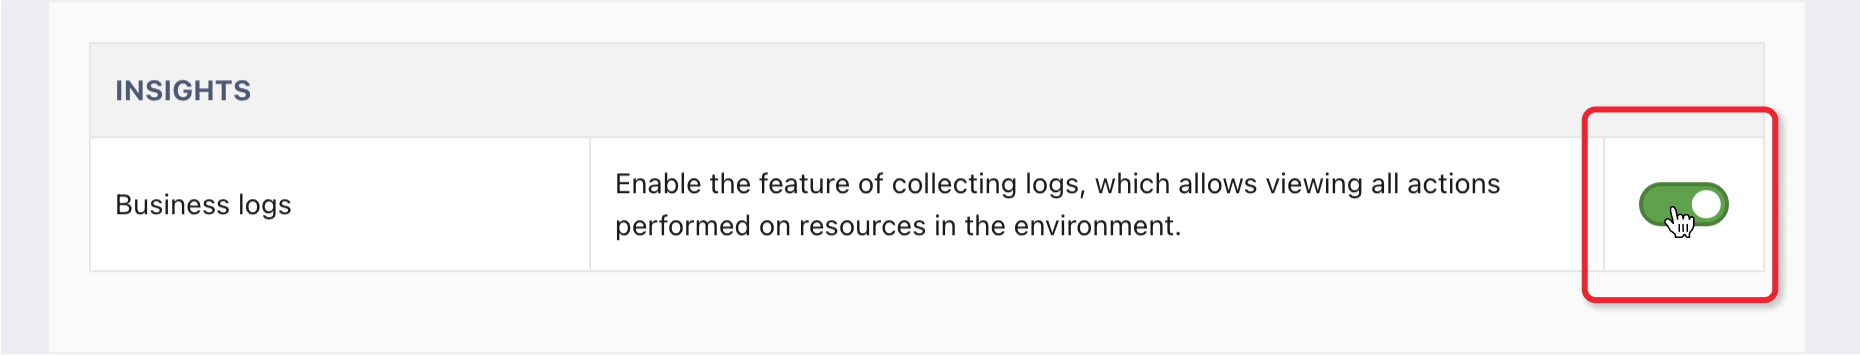
After turning on the toggle, the server will start collecting business and details logs for that environment from now on.
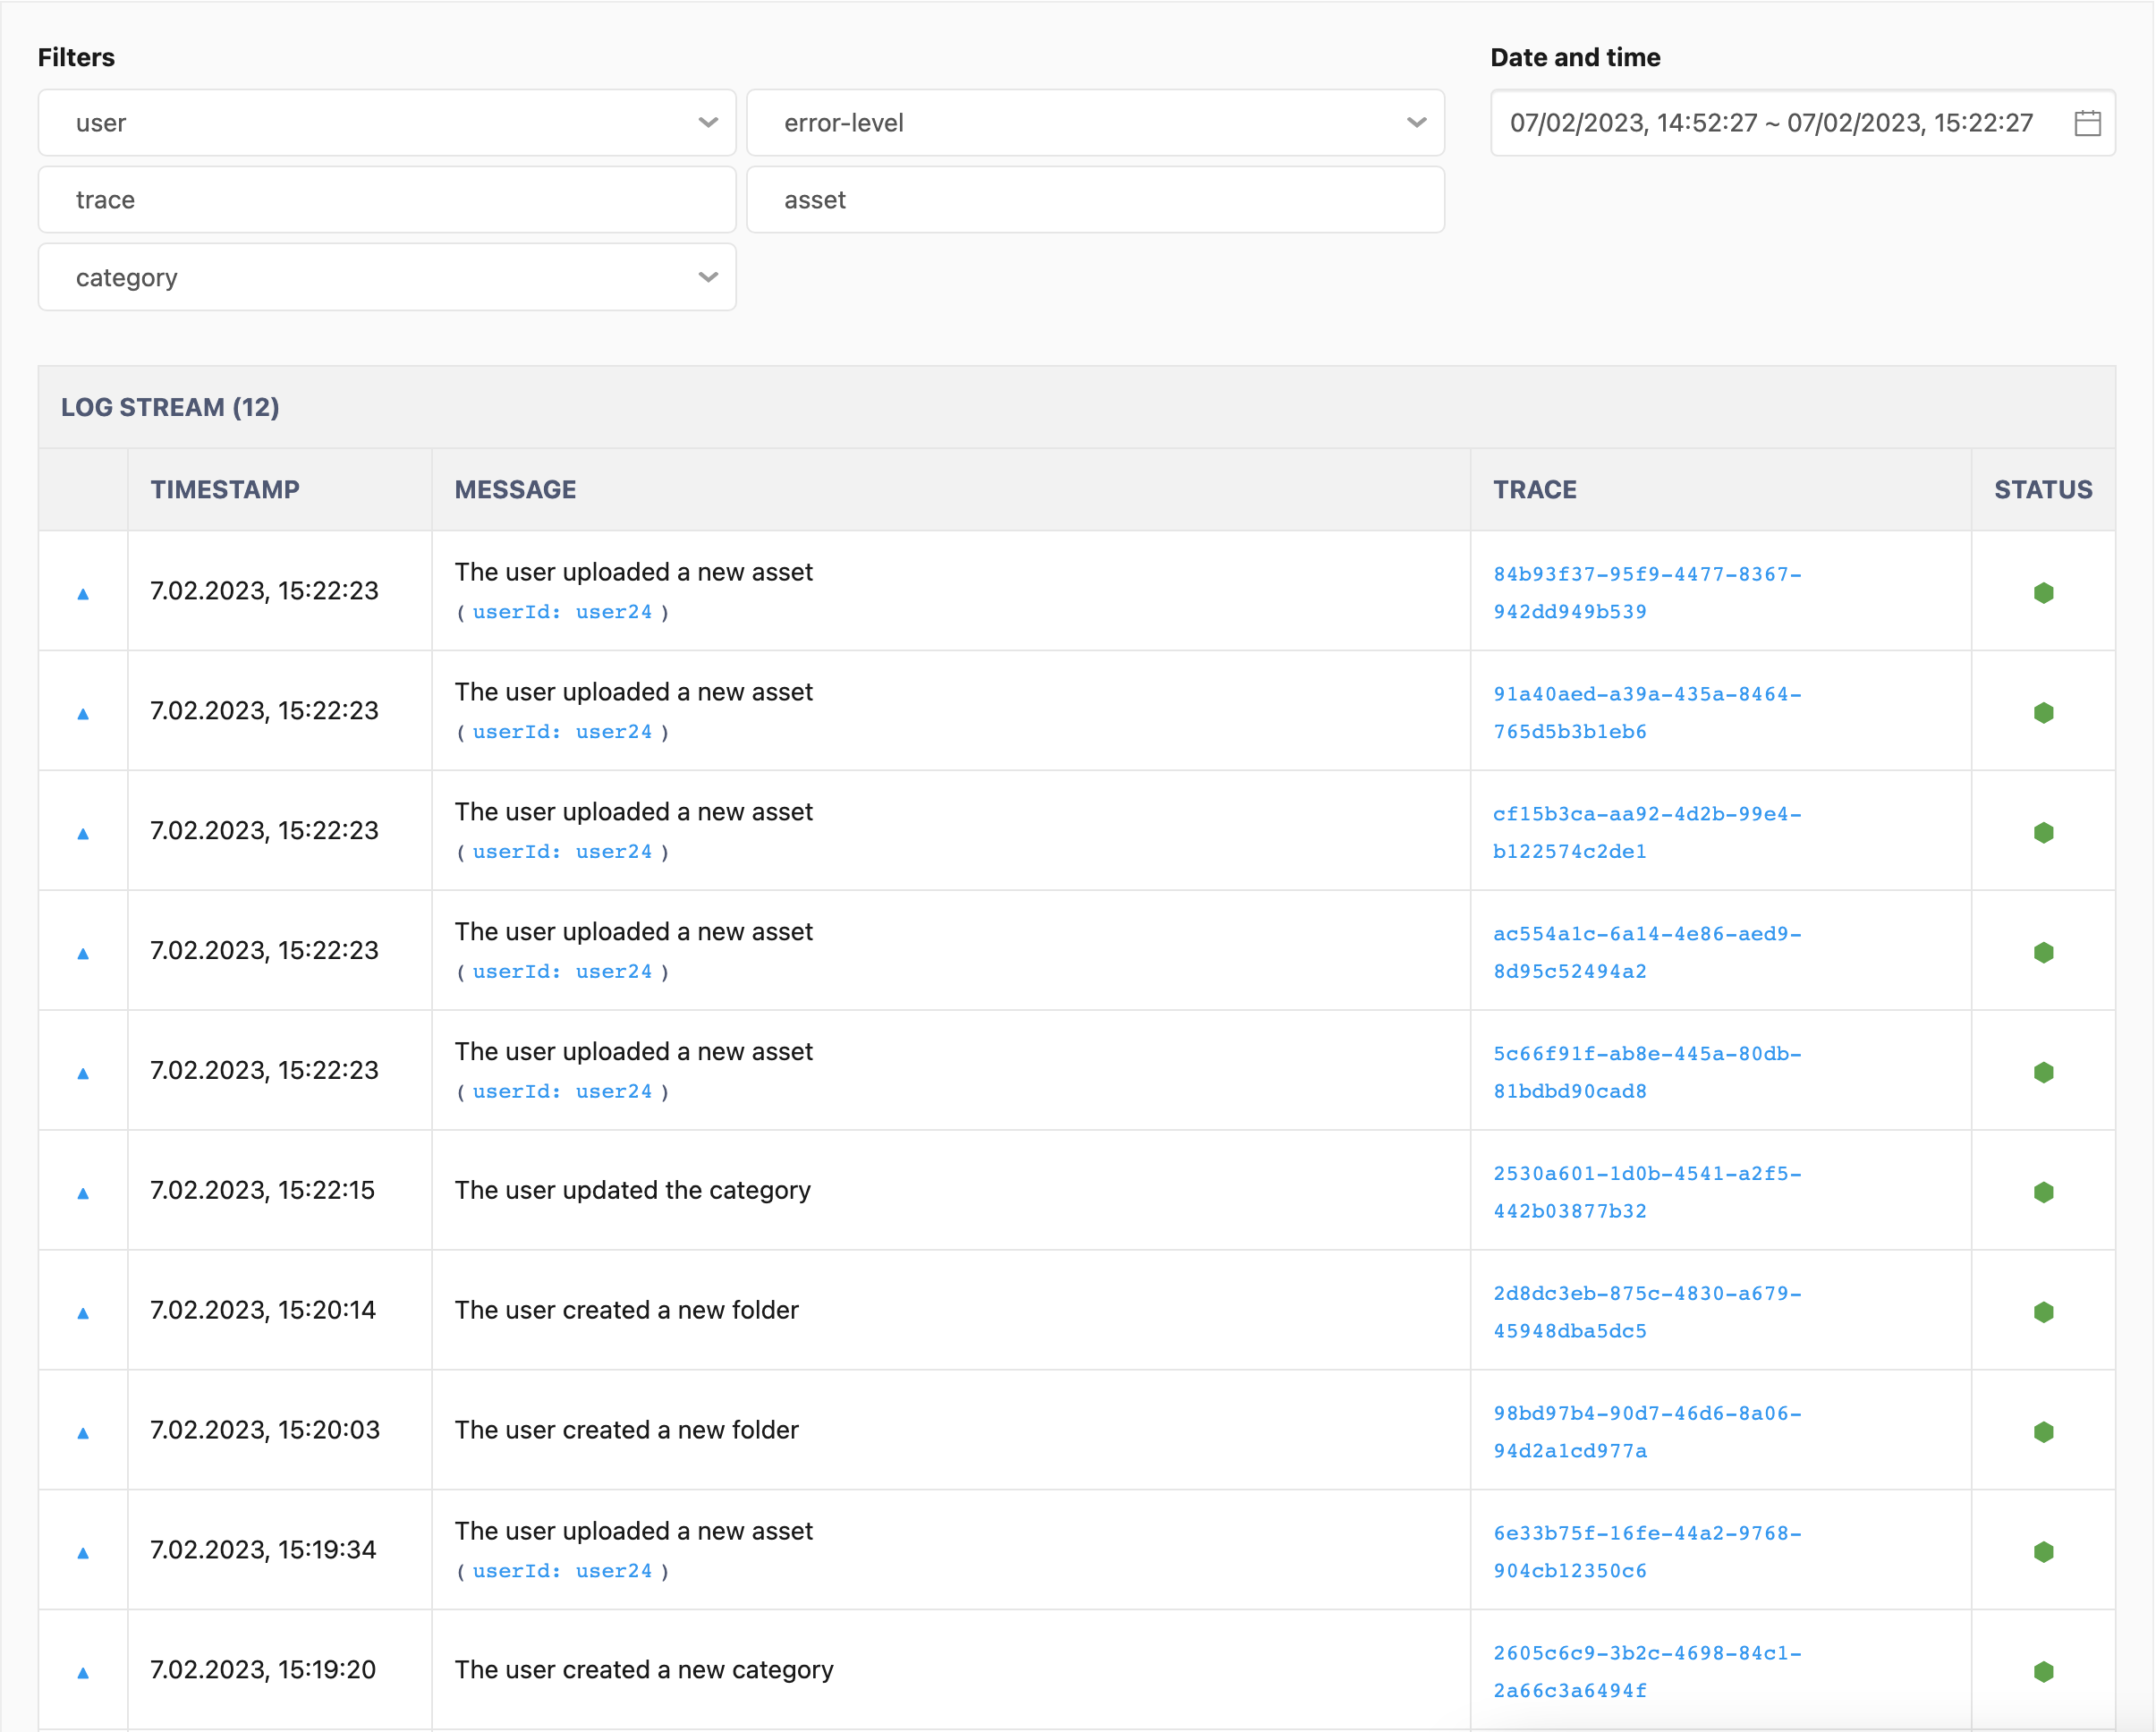
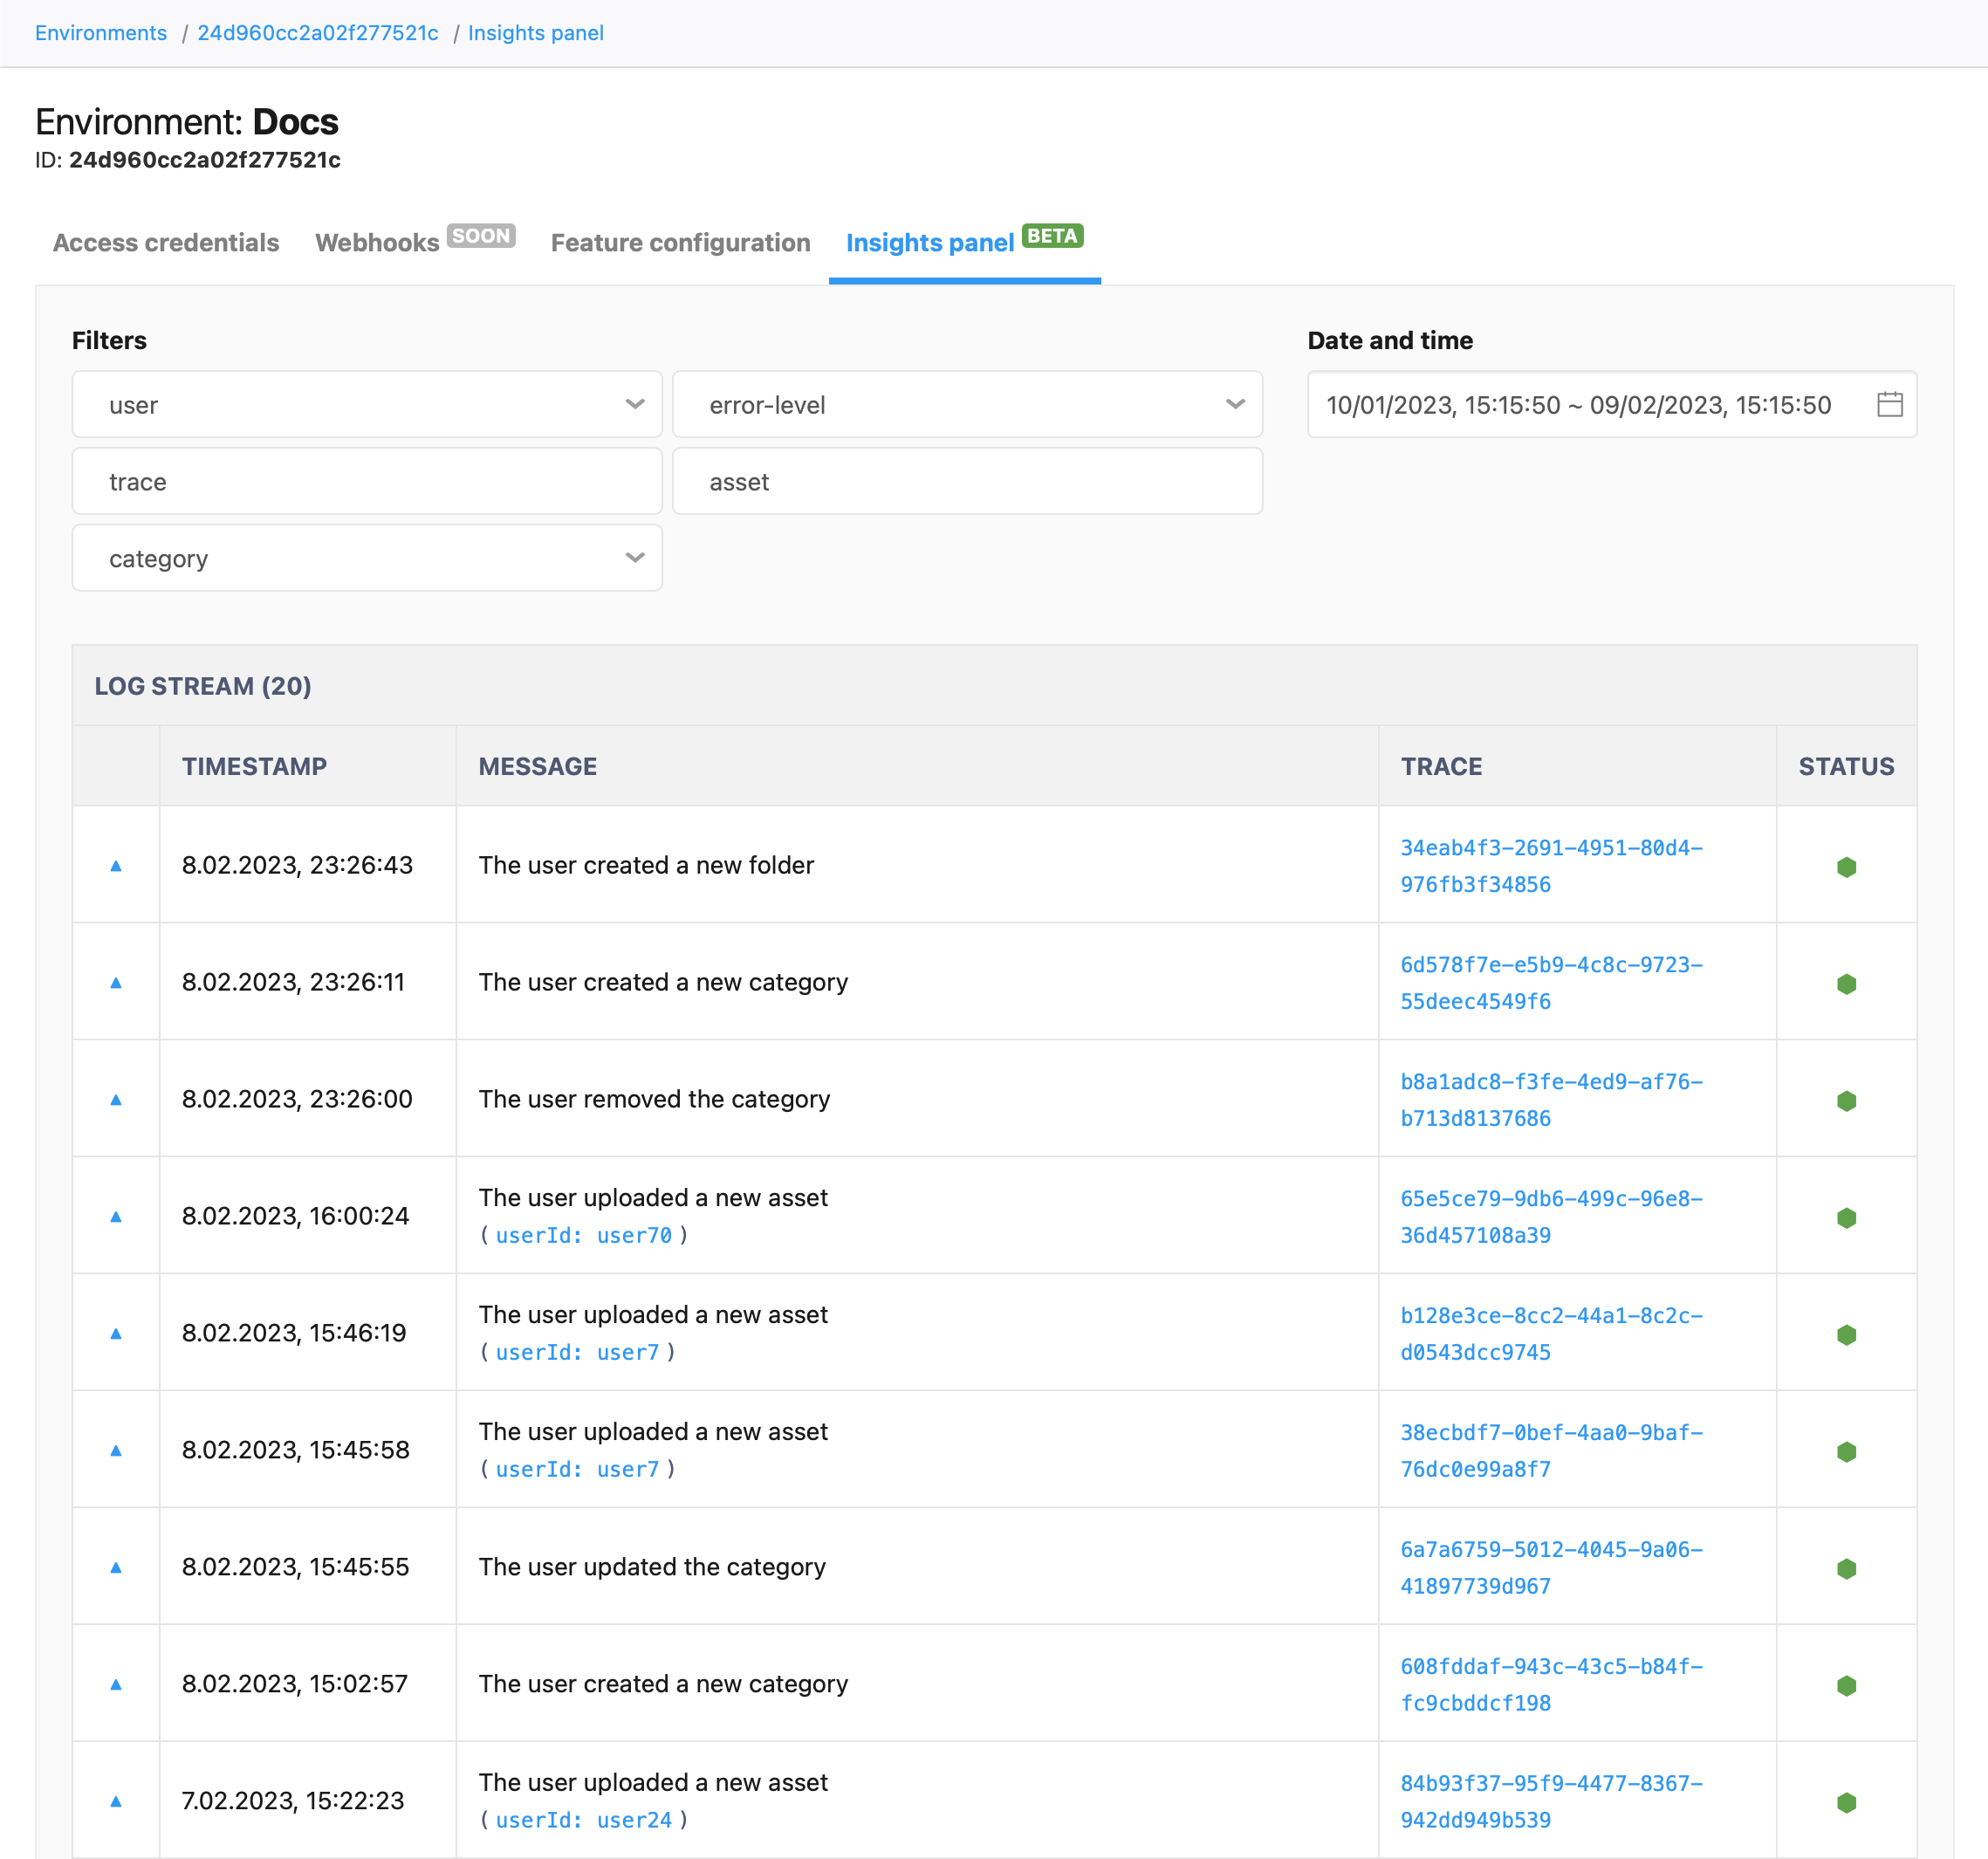
# Listing logs
To list the collected logs, go to the Insights Panel tab in the Cloud Services Dashboard (or in the Management Panel if you are using the On-Premises version). By default, the log list displays the business and the details logs from the last 5 minutes. To change the time range, use the date picker to set the desired filtering range.
# Filtering logs
To search the logs, you can use filters to narrow down the desired results.
The currently available filters are:
user– filtering byuserId,error level– filtering bywarn,failanderrorlevels,trace– filtering bytraceId,asset– filtering byassetId,category– filtering bycategoryId.
Filters can be combined.
You can paste the filter value into the filter box (useful for searching by trace). It is also possible to choose one of the suggested values – these are aggregated from the logs matching your queries.
# Log structure
Here are the key fields included in a log:
msg– A detailed log message.traceId– A unique RPC call ID.data– An object containing additional information. It may vary between different logs.time– An occurrence date.tags– Tags associated with the log. The possible tags arebusiness(information about the main action initiated by the user or an API) ordetails(detailed information about the main action or information about additional events that have been triggered by the main action).status– The result of a logged action.
An example log:
{
    "msg": "The user uploaded a new asset (userId: xhb1jjs10uq8un9wt0vc)",
    "traceId": "b36f1967-7778-4c0d-97a2-37caba24d59e",
    "data": {
      "assetId": "vem71503nieel8ewoxjb",
      "environmentId": "ciy6g1w4y1a6qm146our",
      "folderId": "f5qt-UIwHFqq",
      "userId": "xhb1jjs10uq8un9wt0vc",
      "originalFileName": "spreadsheet.xlsx",
      "mimeType": "application/octet-stream"
    },
    "time": "2023-02-07T09:53:01.257Z",
    "tags": "business",
    "status": "success"
}
Log stream records are grouped together and can contain both the business and details logs linked together by traceId. Log details are available after clicking on the log record.
# Log retention
All logs older than 14 days are periodically removed from the environment. This is done automatically and does not require additional configuration.
Need more functionality? Take a survey and help us develop CKBox to suit your needs better!